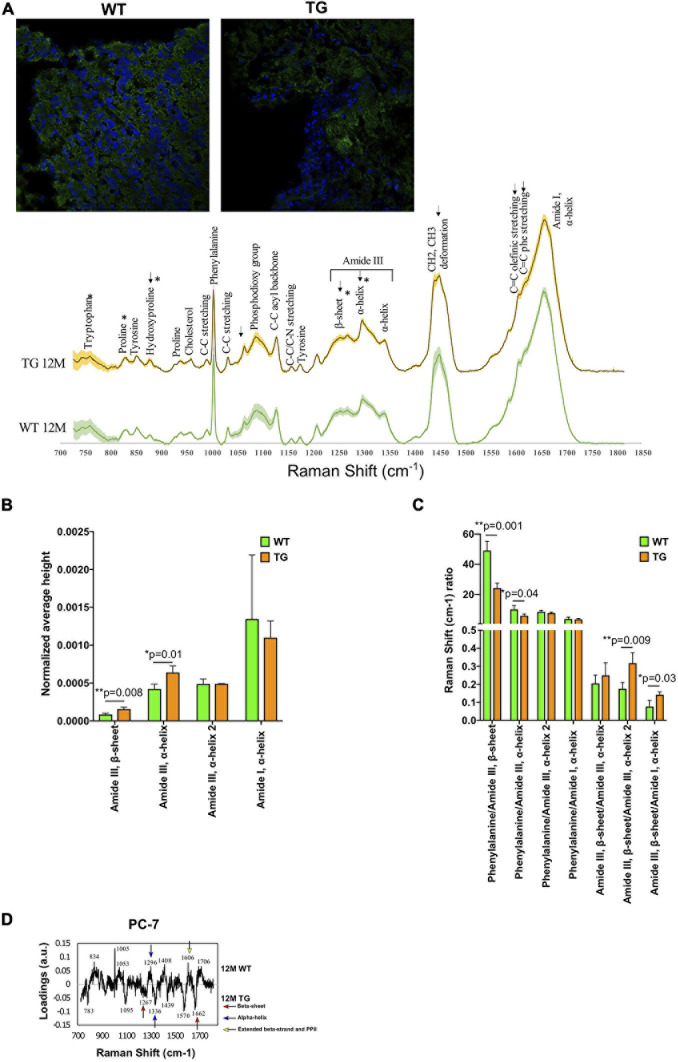
FIGURE 1.
Spectral comparison in 12M WT and TG olfactory bulb regions. (A) Immunofluorescence images show the staining of α-Syn in the WT and TG olfactory bulb region of the brain (upper panel) and the spectra of WT and TG olfactory bulb regions (lower panel) and shaded areas indicate standard deviation. (B) All the marked changes were from the statistical 12M WT and TG intensity comparison based on Student’s unpaired t-test. Differences were detected in the tryptophan (p = 0.04), proline (p = 0.02), hydroxyproline (p = 0.04), amide III, β-sheet (p = 0.008), and amide III, α-helix (p = 0.01) peaks. p-Value represents *(p ≤ 0.05), **(p ≤ 0.01). (C) The ratio of different peaks from amide I and amide III were compared with Student’s unpaired t-test to identify statistical changes. Differences were detected in the phenylalanine/amide III–β-sheet (p = 0.001), phenylalanine/amide III–α-helix (p = 0.04), amide III–β-sheet/amide III–α-helix (p = 0.009), and amide III–β-sheet/amide I–α-helix (p = 0.03). p-Value represents *p ≤ 0.05 and **p ≤ 0.01. (D) The 12M WT and TG samples were compared with PCA of PC-6 and PC-7. The loadings of PC-7 were visualized. Positive side WT while negative side TG brain samples.

