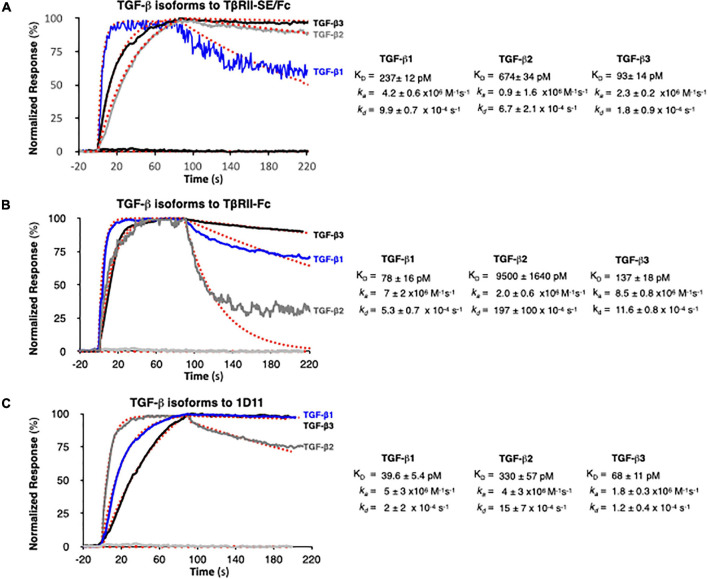
FIGURE 4.
SPR binding profiles of 30 nM TGF-β isoforms to Fc-captured recombinant TβRII-SE/Fc, TβRII-Fc, and 1D11 mAb. Normalized association (t = 90 s) and dissociation profiles (t = 130 s shown) for (A) TβRII-SE/Fc, (B) TβRII-Fc, and (C) 1D11 mAb complexes with each TGF-β isoform are shown overlayed with the respective global model fits (red dashed lines). Blue: TGF-β1, gray: TGF-β2, and black: TGF-β3. Calculated kinetic parameters are shown to the right for each interaction.

