Figure 6.

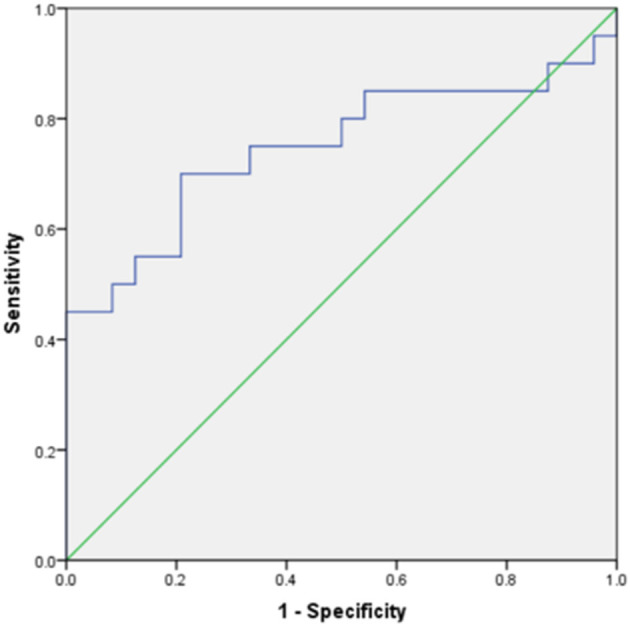
The ROC curve of skewness in the T2WI histogram between the endometrial mesenchymal sarcoma group and degenerative hysteromyoma group.

The ROC curve of skewness in the T2WI histogram between the endometrial mesenchymal sarcoma group and degenerative hysteromyoma group.