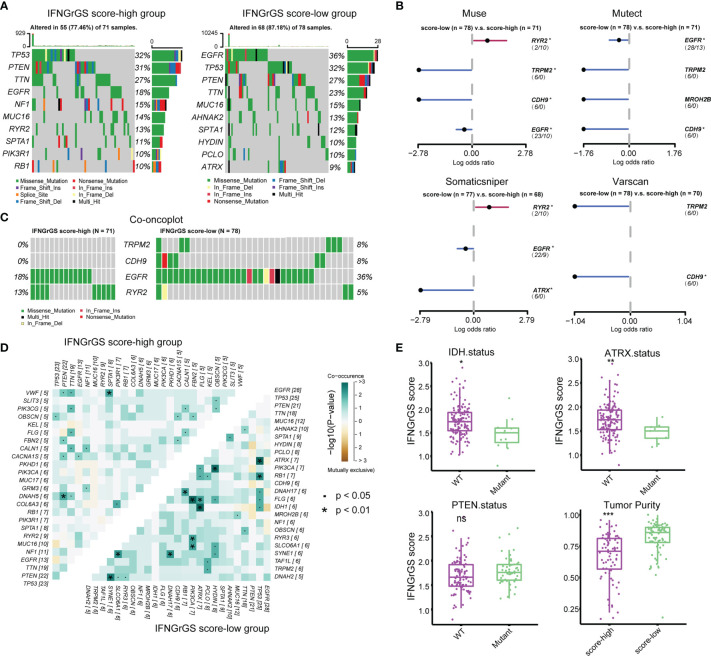
Figure 5.
Tumor genomic alterations associated with IFNGrGS-based stratification. (A) The top 10 mutated genes in the IFNGrGS score-high and -low groups based on the somatic mutation file ‘mutect’. (B) DMGs in the IFNGrGS score-high and -low groups based on 4 somatic callers using Fisher’s exact test. (C) The mutation type and frequency of TRPM2, CDH9, EGFR, and RYR2 based on the ‘mutect’ file. (D) Co-occurring and mutually exclusive gene pairs. Upper panel: the IFNGrGS score-high group, and lower panel: the IFNGrGS score-low group. (E) The association between the IFNGrGS score and IDH, ATRX, and PTEN gene mutation, and the tumor purity. *p < 0.05, **p < 0.01, ***p < 0.001, and ns, non-significant.

