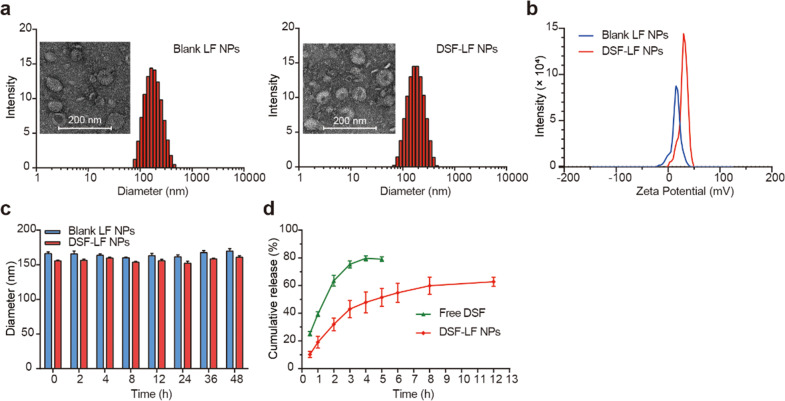
Fig. 1. Characterization of the NPs.
a Size distribution and TEM of the blank LF NPs and DSF-LF NPs. b ζ potential of the blank LF NPs and DSF-LF NPs. c Stability of blank LF NPs and DSF-LF NPs in PBS containing 10% FBS. d In vitro release of DSF from the DSF-LF NPs. Data are presented by mean ± SD (n = 3).

