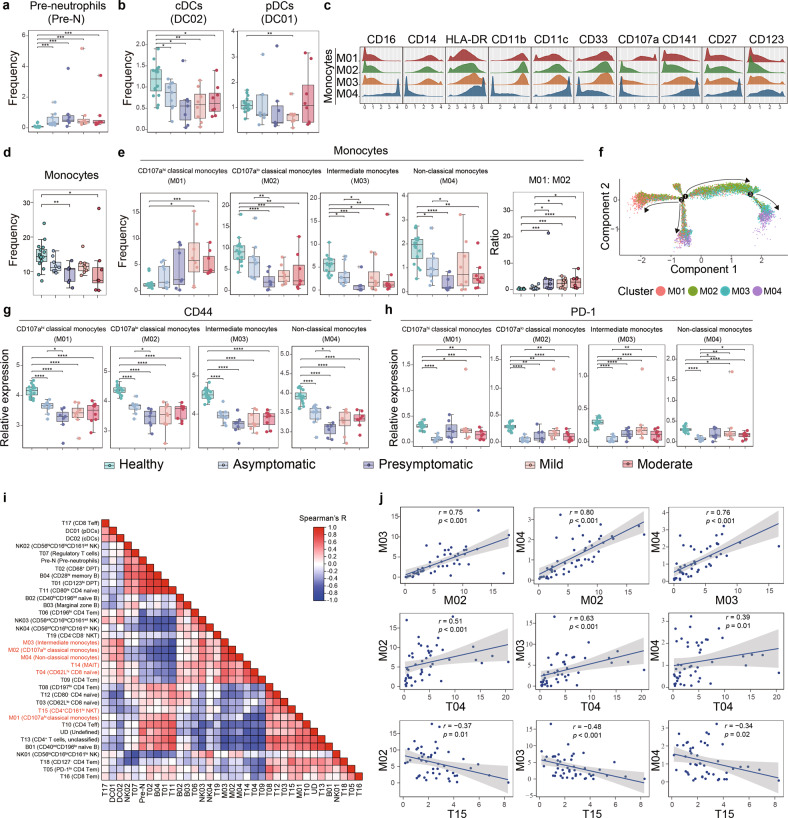
Fig. 3. Monocytic abnormalities associate with lymphocytic alterations across the groups.
a, b Boxplots showing the frequencies of the pre-neutrophils (a) and those of the cDCs and pDCs (b) across the groups. c Histograms indicating the expressions of indicated monocytic lineage markers and costimulatory molecules in four monocytic clusters. d Boxplot of the frequencies of the total monocytes across the groups. e Boxplots showing the frequencies of the monocytic clusters and the cluster M01 to cluster M02 ratios across the groups. f Monocle 2 trajectory analysis was performed on a combined dataset of monocytes across the groups. Monocle plot displays monocytes color-coded by different monocytic clusters. g, h Boxplots showing the expression of CD44 (g) and PD-1 (h) in the monocytic clusters across the groups. i Heatmap showing Spearman correlations using the frequencies of immune cell clusters in all samples. j Scatterplots showing relationships between the frequencies of selected clusters. For significant correlations, linear models are shown as blue lines. Significance in a, b, d, e, g, h was determined by unpaired Wilcoxon test. *P < 0.05, **P < 0.01, ***P < 0.001, ****P < 0.0001.

