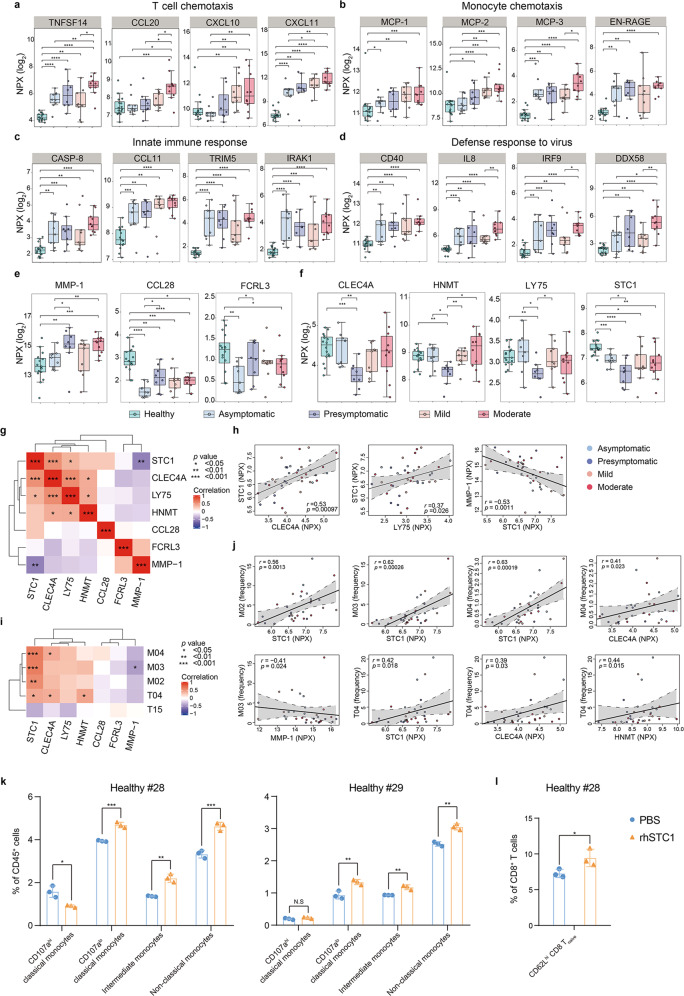
Fig. 5. Characterization of the plasma inflammatory factors differentially presented in two SSIS groups.
a–d Boxplots depicting the plasma levels of different types of inflammatory factors among the healthy controls, asymptomatic and presymptomatic subjects, mild and moderate COVID-19 patients. Unpaired Wilcoxon test was employed. e, f Boxplots of cytokines and other inflammatory factors reaching statistical significance in presymptomatic subjects compared with asymptomatic subjects. Unpaired Wilcoxon test was employed. g Heatmap showing Spearman correlations of the expression of indicated factors in the four SARS-CoV-2pos groups. h Scatterplots showing relationships between the expression of selected inflammatory factors. i Heatmap showing Spearman correlations between frequencies of the indicated clusters and the expression of the selected inflammatory factors in the four SARS-CoV-2pos groups. j Scatterplots showing relationships between the frequencies of the indicated clusters and the expression of the selected factors. k, l Flow cytometric analyses of the frequencies of four monocytic subsets within CD45+ cells (k) or CD62Lhi CD8+ Tnaïve cells within CD8+ T cells (l) using BMMCs from healthy controls cultured with Serum-free Hematopoietic Cell Medium with or without rhSTC1 for 3 days. Unpaired Student’s t-test was employed. *P < 0.05, **P < 0.01, ***P < 0.001, ****P < 0.0001.

