
Fig. 3: Association of brown fat with cardiometabolic disease and laboratory values.
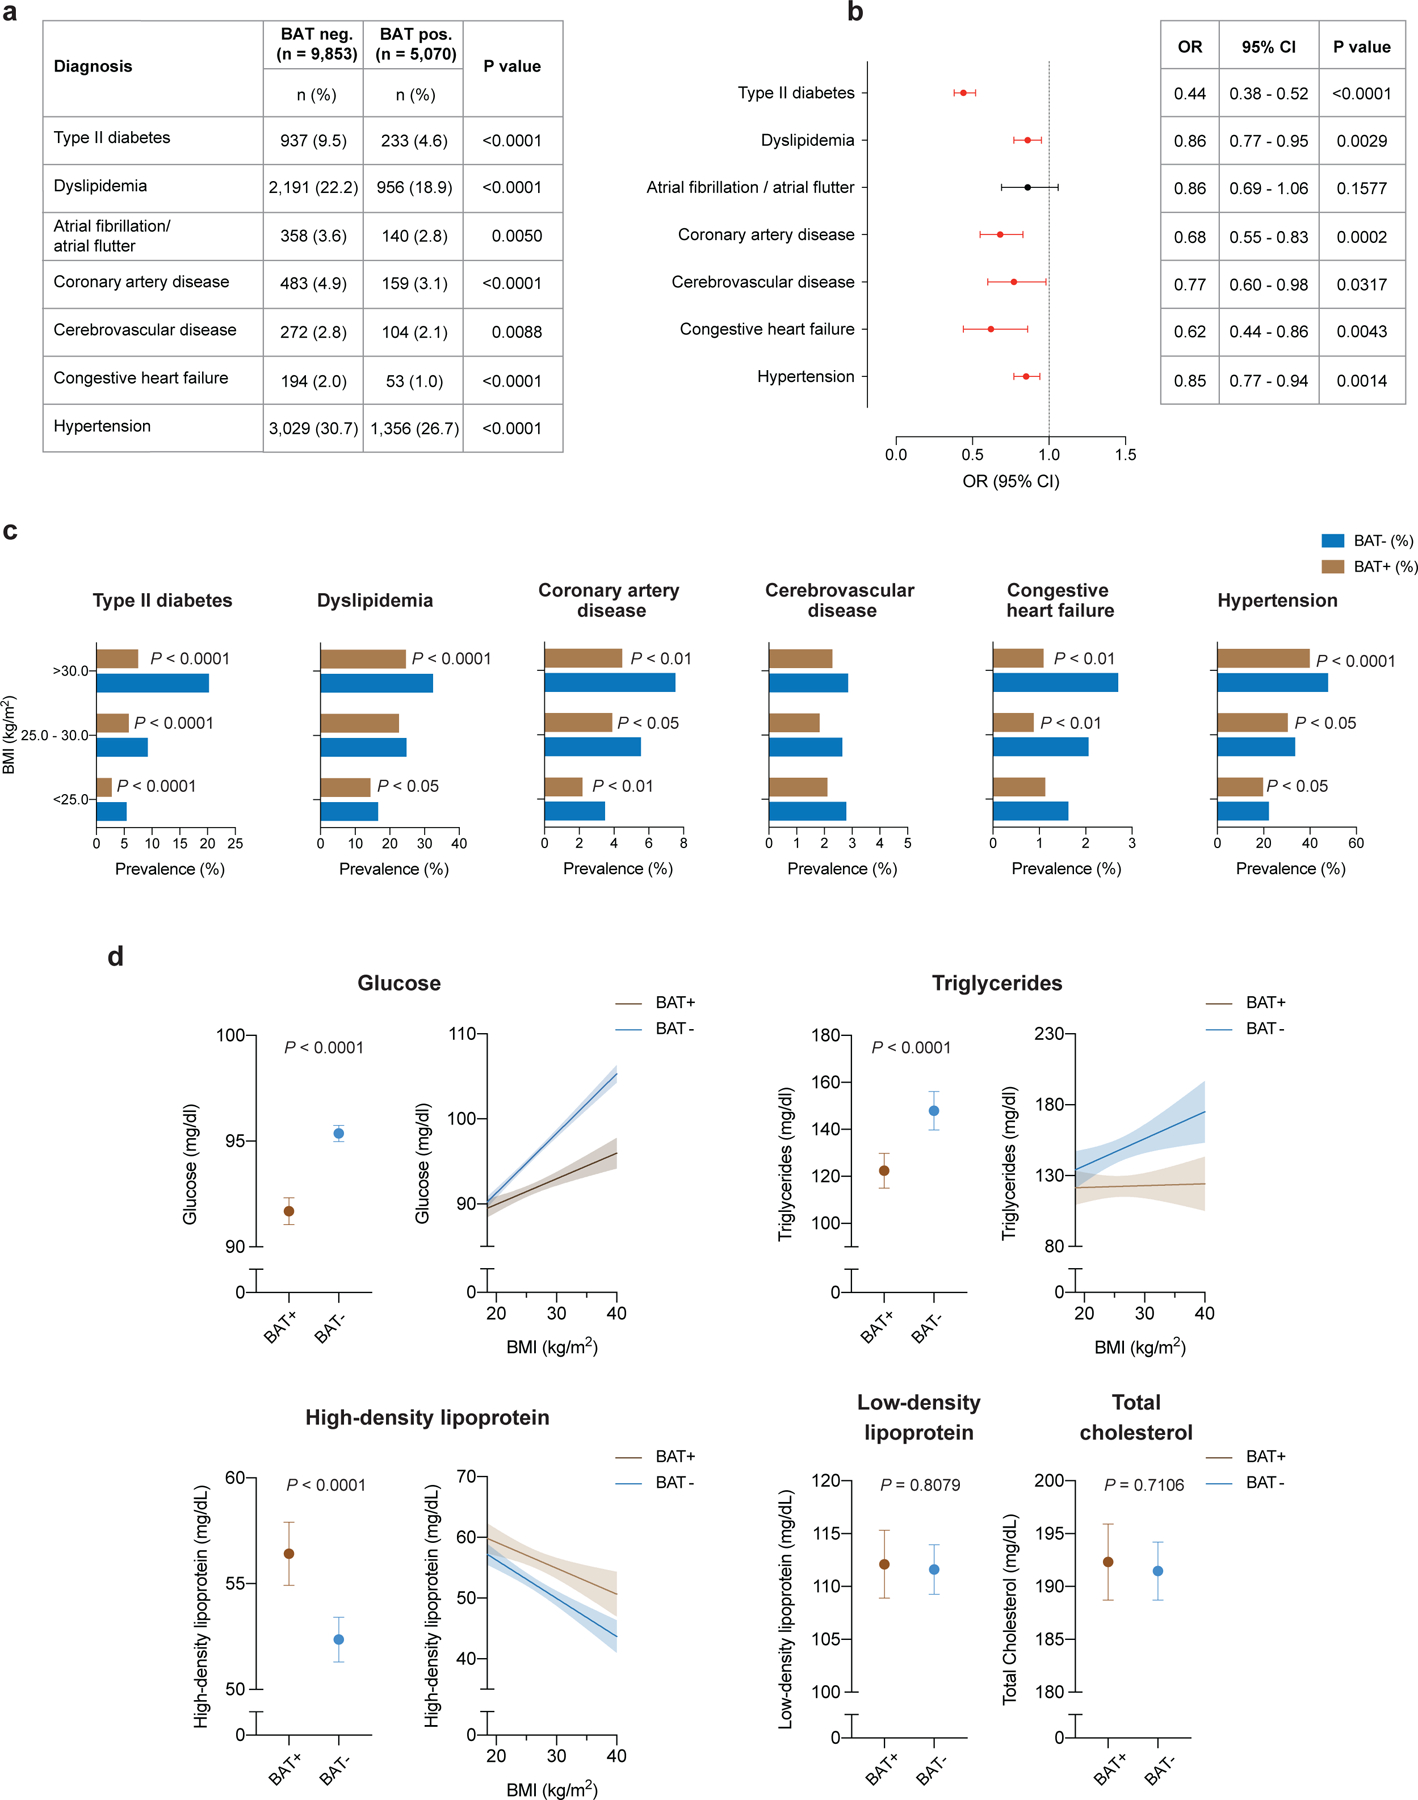
a, Comparison of cardiometabolic disease prevalence between individuals with and without BAT. b, Forest plots illustrate the association between brown fat status and cardiometabolic disease in the propensity score-matched cohort. Circles and bars represent ORs and 95% CIs, respectively. c, Prevalence of cardiometabolic disease stratified by brown status and BMI using the World Health Organization categories for normal and underweight (BMI < 25.0 kg m−2), overweight (BMI between 25.0 and 30.0 kg m−2) and obesity (BMI > 30.0 kg m−2). Patients per category: BMI < 25.0 kg m−2, with brown fat n = 2,564, without brown fat n = 4,912; BMI between 25.0 and 30.0 kg m−2, with brown fat n = 1,589, without brown fat n = 3,016; BMI > 30.0 kg m−2, with brown fat n = 917, without brown fat n = 1,925. d, Comparison of available laboratory values between matched individuals with and brown fat (glucose; with brown fat n = 5,033 (99.3%), without brown fat n = 9,707 (98.5%); triglycerides, with brown fat n = 732 (14.4%), without brown fat n = 1,444 (14.7%); HDL, with brown fat n = 596 (11.8%), without brown fat n = 1,185 (12.0%); LDL, with brown fat n = 543 (10.7%), without brown fat n = 1,070 (10.9%); total cholesterol, with brown fat n = 637 (12.6%), without brown fat n = 1,267 (12.9%). Dots are means; error bars depict 95% CIs. Shaded bands indicate 95% CIs fitted by linear regression.