
Extended Data Fig. 4. Standardized mean differences before and after propensity score matching.
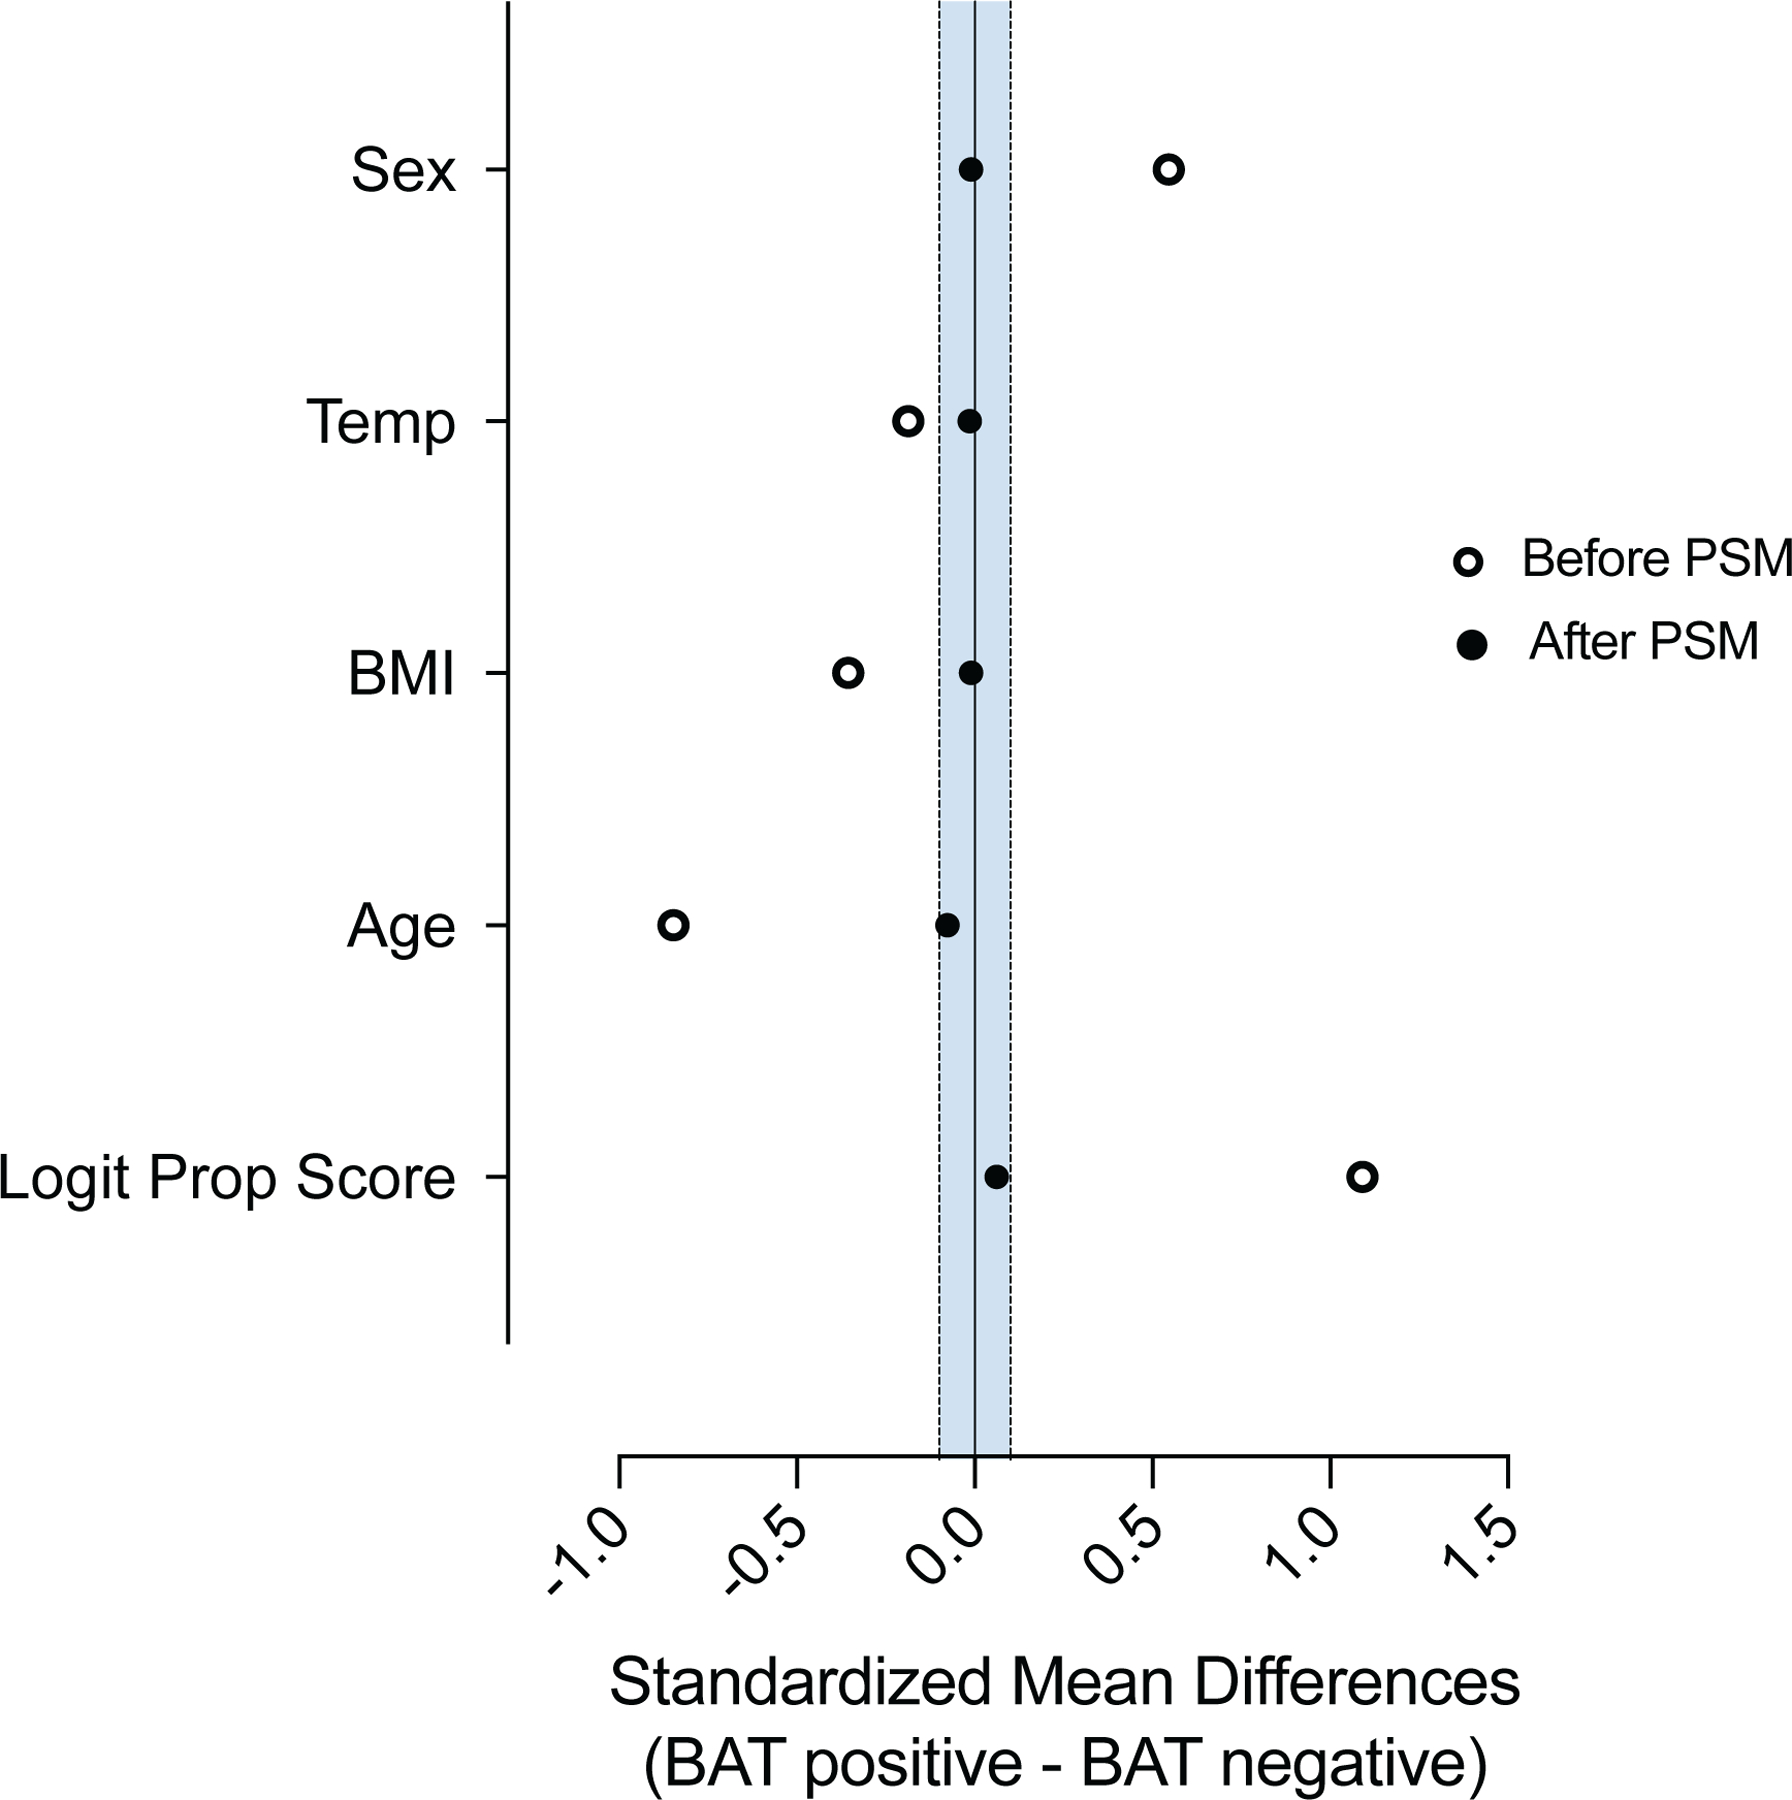
Propensity score matching was assessed by comparing standardized mean differences before and after the matching process. The blue shaded area indicates standardized mean differences between 0.1 and −0.1.