
Extended Data Fig. 5: Assocation of brown fat and cardiometabolic disease and additional adjustment for type II diabetes or index scan position.
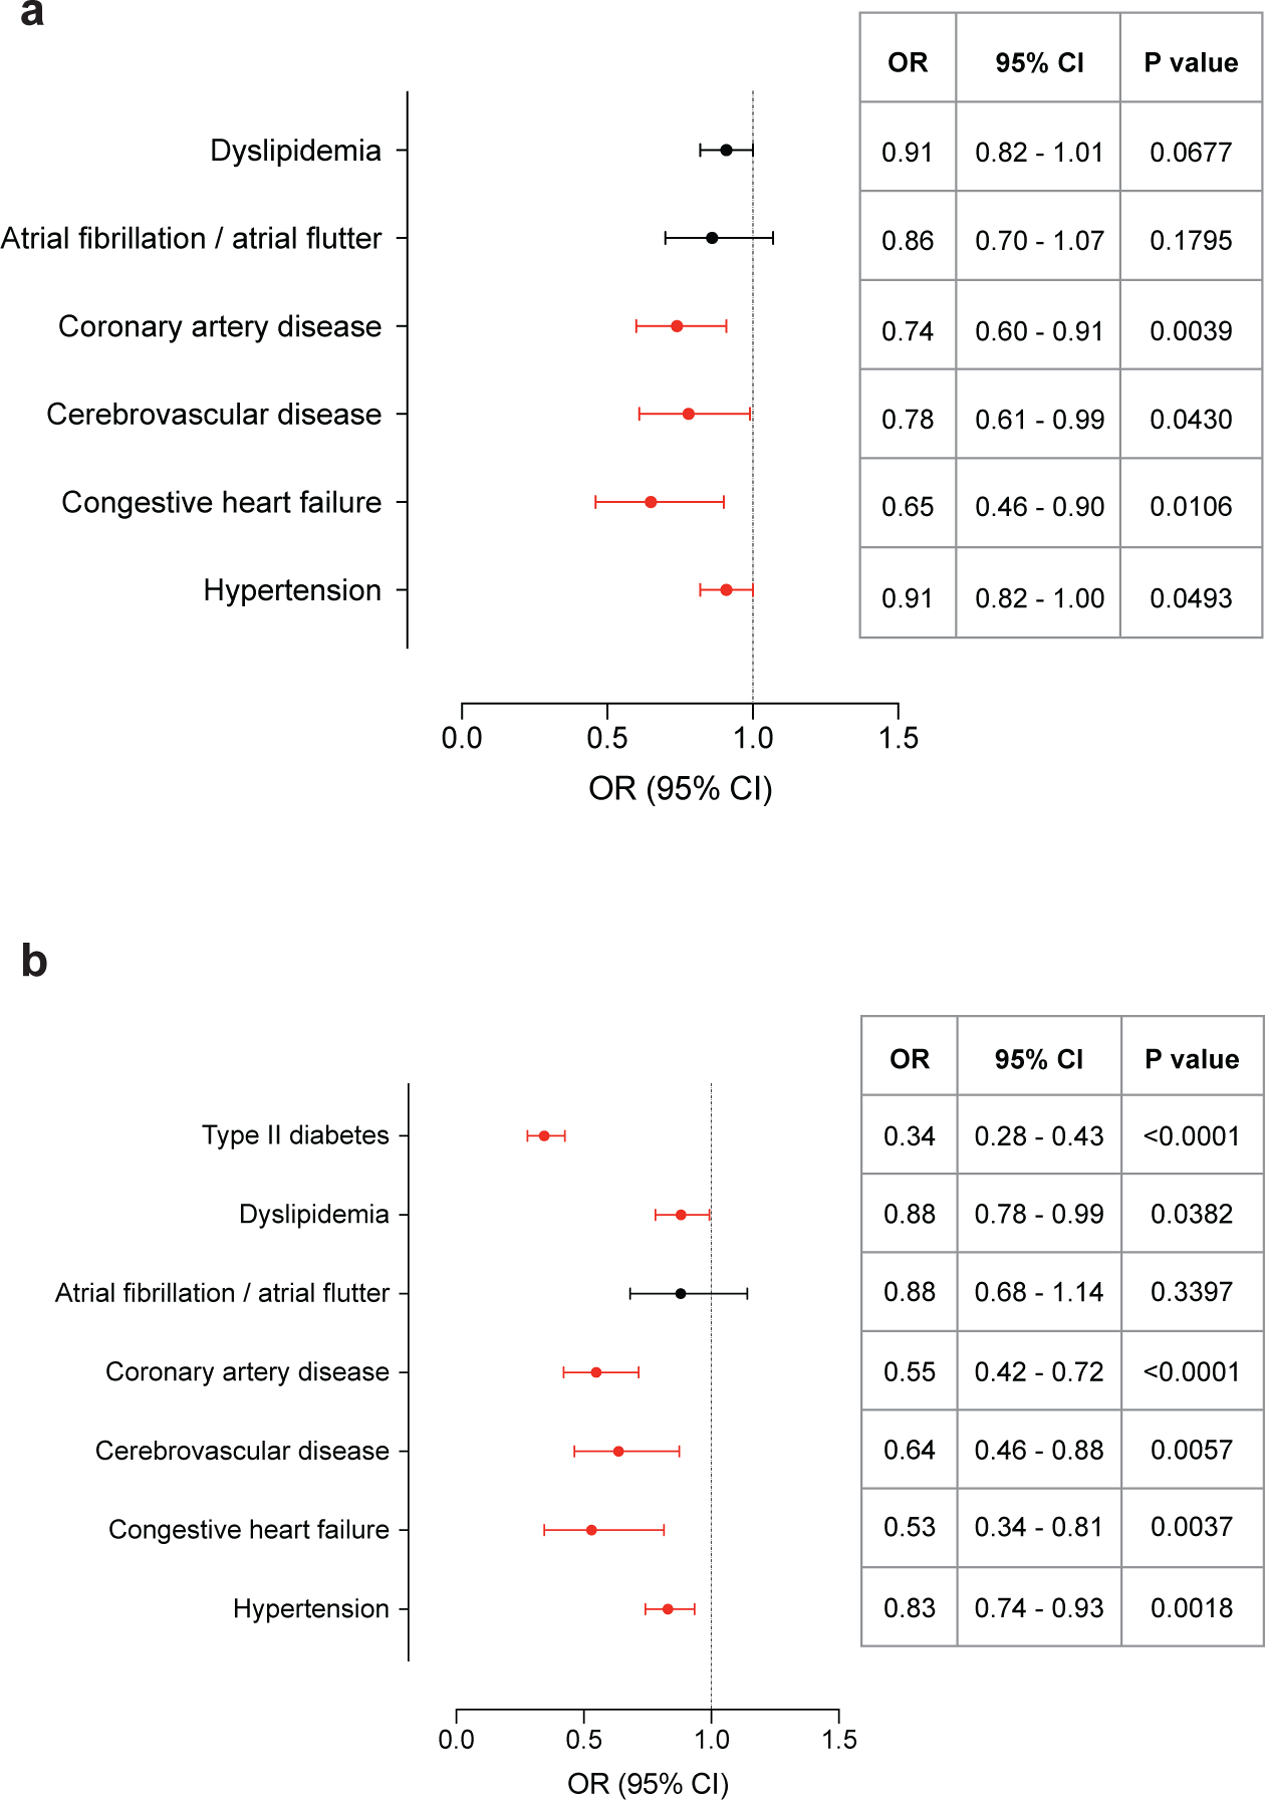
a, Forest plots illustrate the association between brown fat status and cardiometabolic disease in the propensity score matched cohort, with additional adjustment for T2DM. Circles and bars represent odds ratios (ORs) and 95% confidence intervals (CIs) respectively. b, Forest plots illustrate the association between brown fat status and cardiometabolic disease in the propensity score matched cohort, with additional adjustment for index scan position. Circles and bars represent odds ratios (ORs) and 95% confidence intervals (CIs), respectively.