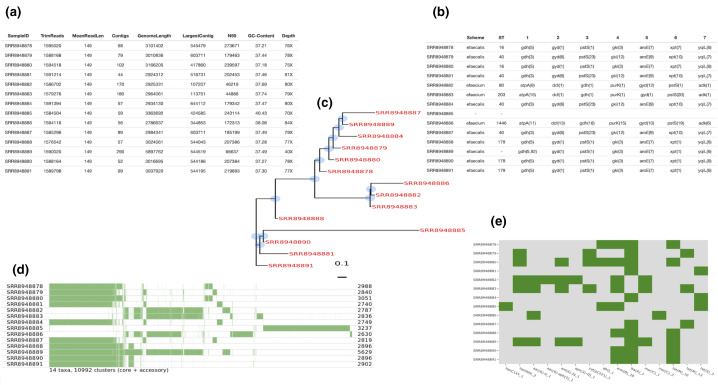
Fig. 2.
Selected interactive Enterococcus species HTML reports. (a) Genome assembly summary statistics for the different Enterococcus species isolates. These include common genome analysis key metrics for checking assembly quality. (b) Table of multi-locus sequence typing (MLST) distribution. (c) SNP-based approximately maximum-likelihood phylogenetic tree. Three different formats are available, i.e circular (phylogram), circular (cladogram) and rectangular (phylogram). An approximately maximum-likelihood phylogenetic tree is computed based on SNPs detected via read mapping against a reference genome and stored in a standard Newick file format. (d) Pangenome analysis including a schematic representation of gene presence (colour) or absence (blank) between samples. (e) Antibiotic resistance profile. Presence/absence of antibiotic resistance genes (coverage and identity >90 %) for each sample. An antibiotic resistance profile is computed based on Resfinder, CARD, ARG-ANNOT, NCBI and MEGARES annotations for each isolate and transformed into an overview that allows a rapid resistome comparison of all analysed isolates.

