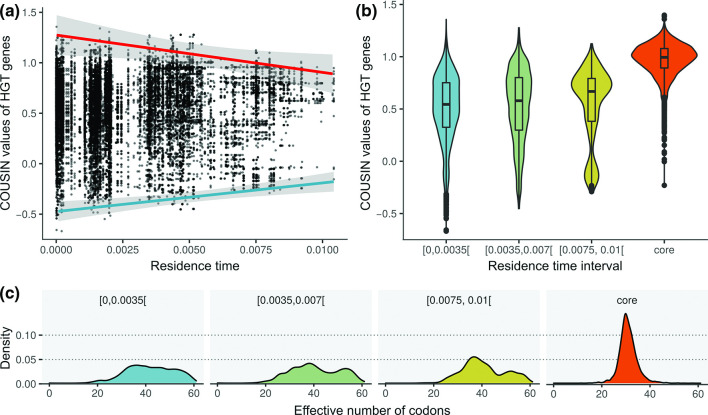
Fig. 2.
Codon usage bias of HGT genes in relation to their residence time. (a) Scatterplot of the COUSIN value of HGT genes in function of their residence time. The COUSIN value incorporates both the direction of codon usage bias (positive values represent a bias in the same direction as the reference, negative values are in the opposite direction) and the strength of codon usage bias (indicated by the absolute values, with 0 indicating the absence of a bias and values above 1 indicating a stronger bias than the reference). The blue and red regression lines were determined by taking respectively the minimal and maximal COUSIN value for each residence time interval of 0.001. (b) Violin plot showing the distribution of COUSIN values of HGT genes for each residence time interval of 0.0035 and the core genes. (c) Density plots showing the distribution of the ENC for HGT genes for each residence time interval of 0.035 and for the core genes. ENC values range between ranges between 20 (only one codon is used for encoding each amino acid) and 61 (all synonymous codons are used more or less equally).

