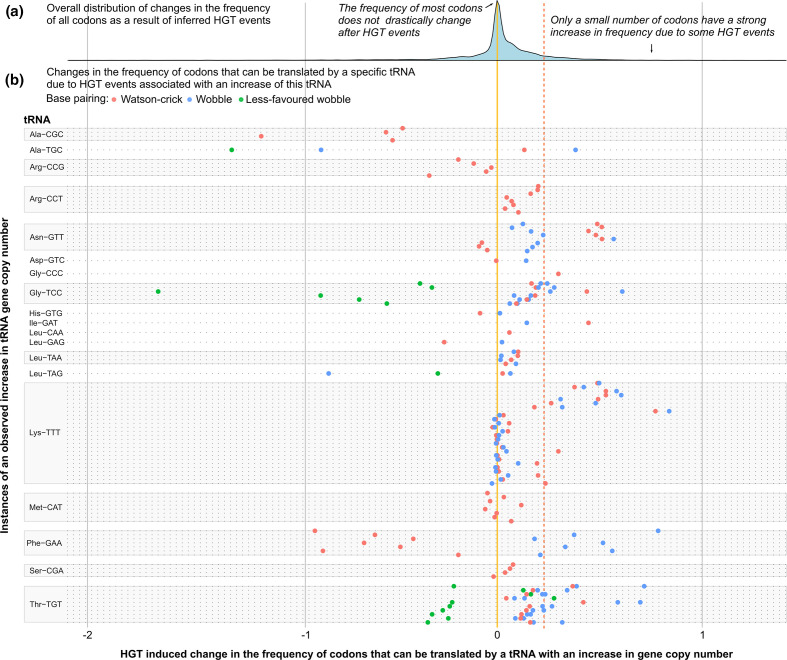
Fig. 4.
Changes in codon frequencies associated with increased tRNA gene copy numbers. Upper panel: distribution of changes in codon frequencies along branches due to HGT (expressed as changes in the expected number of a codon per 1000 bases). The yellow line indicates no change in codon frequency, the red line indicates the 90th percentile. Lower panel: each horizontal line represents a single event of increase in tRNA gene copy number and are grouped per tRNA gene; each point indicates a codon that was affected by this increase (red dots represent Watson–Crick base pairing, blue dots wobble base pairing and green dots less favoured wobble base pairing). The position along the horizontal axis indicates the change in codon frequency due to HGT along the branch where the increase in tRNA gene copy number was observed.

