FIG. 4.
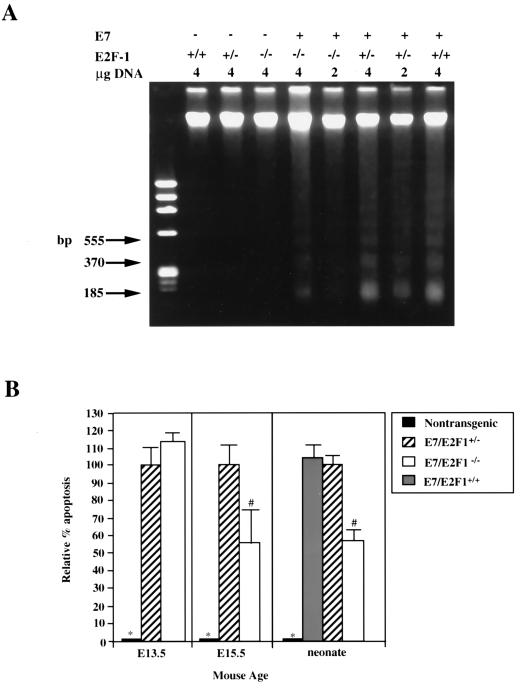
Analysis of apoptosis in lenses from neonatal E7 transgenic mice on E2F-1-sufficient or -deficient backgrounds by using DNA ladder and TUNEL analysis. (A) Total genomic DNA was isolated from lenses of neonatal mice, fractionated on a 2% agarose gel, and stained with ethidium bromide. Indicated for each lane are the genotype of the sample and amount of total genomic DNA loaded on the gel. φX174/HaeIII DNA was used as a molecular weight marker (left lane). The migration positions of the three lowest nucleosomal-length bands that correspond with monomers (185 bp), dimers (370 bp), and trimers (555 bp) are indicated. The abundance of small nucleosomal-length DNA fragments and that of high-molecular-weight fragments (means ± standard errors of the means) were quantified from scans of three independent negatives. Ratios were calculated, and the data were averaged and subjected to statistical analysis (see the Materials and Methods section and the Results section). The levels of apoptosis for the E7/E2F-1+/− mice and E7/E2F-1−/− mice were significantly different from those for the three genotypes lacking E7 (P < 0.01; see panel B, right). (B) TUNEL analyses were performed on sections from day E13.5 and day E15.5 embryos (left and middle, respectively) from nontransgenic, E7/E2F-1+/−, and E7/E2F-1−/− mice. Apoptotic indices (percent apoptosis) and relative apoptotic indices for each genotype compared to the apoptosis in lenses from E7/E2F-1+/− mice were calculated and subjected to statistical analyses (see the Materials and Methods and Results sections). The relative percents apoptosis for lenses from neonates (right) were calculated from DNA ladder analyses (see the Materials and Methods and Results sections and panel A). The relative percents apoptosis for the genotypes marked (with ∗ or #) were significantly different (P < 0.05) from that for other groups.

