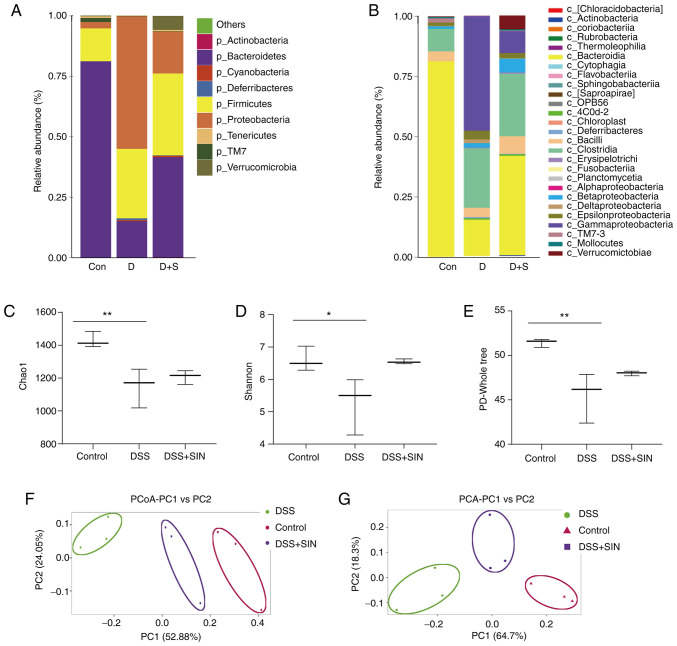
Figure 3.
Analysis of gut microbiota composition and diversity. (A) Phylum level microbial changes. (B) Class level microbial changes. Microbiome diversity differences based on the (C) Chao1, (D) Shannon and (E) PD-Whole tree. (F) PCoA and (G) PCA of gut microbial communities. *P<0.05 and **P<0.01 as indicated. PCoA, principal coordinate analysis; PCA, principal component analysis; DSS, dextran sulfate sodium; SIN, sinomenine hydrochloride; PC, principal component.

