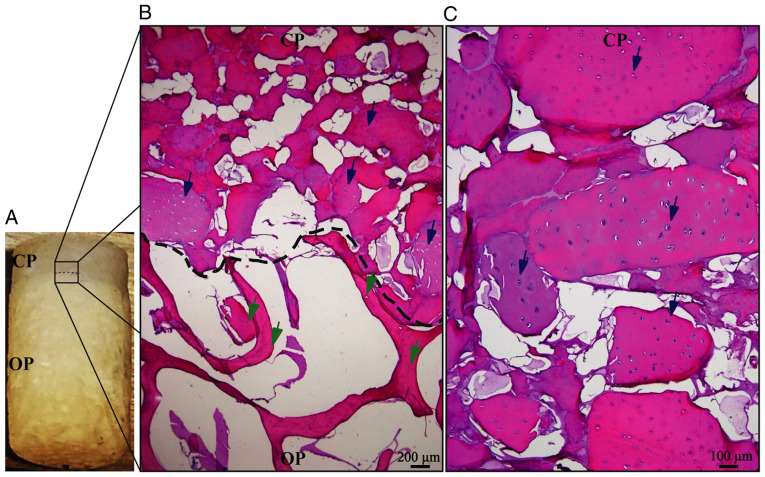
Figure 4.
Cell migration into the biphasic scaffold. Cell migration inside the biphasic scaffolds was analyzed by H&E staining. (A) Macroscopic view of the biphasic scaffold, in which the CP and OP may be observed. (B) Microscopic view of the interphase between the CP and OP. The dotted line indicates the phase borderline and Ad-MSCs were present only in the CP of the scaffold (blue arrows). No cells were present in the OP, where empty lacunae can be observed (green arrows) (scale bar, 200 µm). (C) Zoom view of the CP. Ad-MSCs may be observed inside the cartilage lacunae (blue arrows), individually aligned or forming isogenic groups (scale bar, 100 µm). Ad-MSCs, adipose-derived mesenchymal stem cells; CP, chondrogenic phase; OP, osteogenic phase.

