
Figure 2. Gene Set Enrichment Analysis.
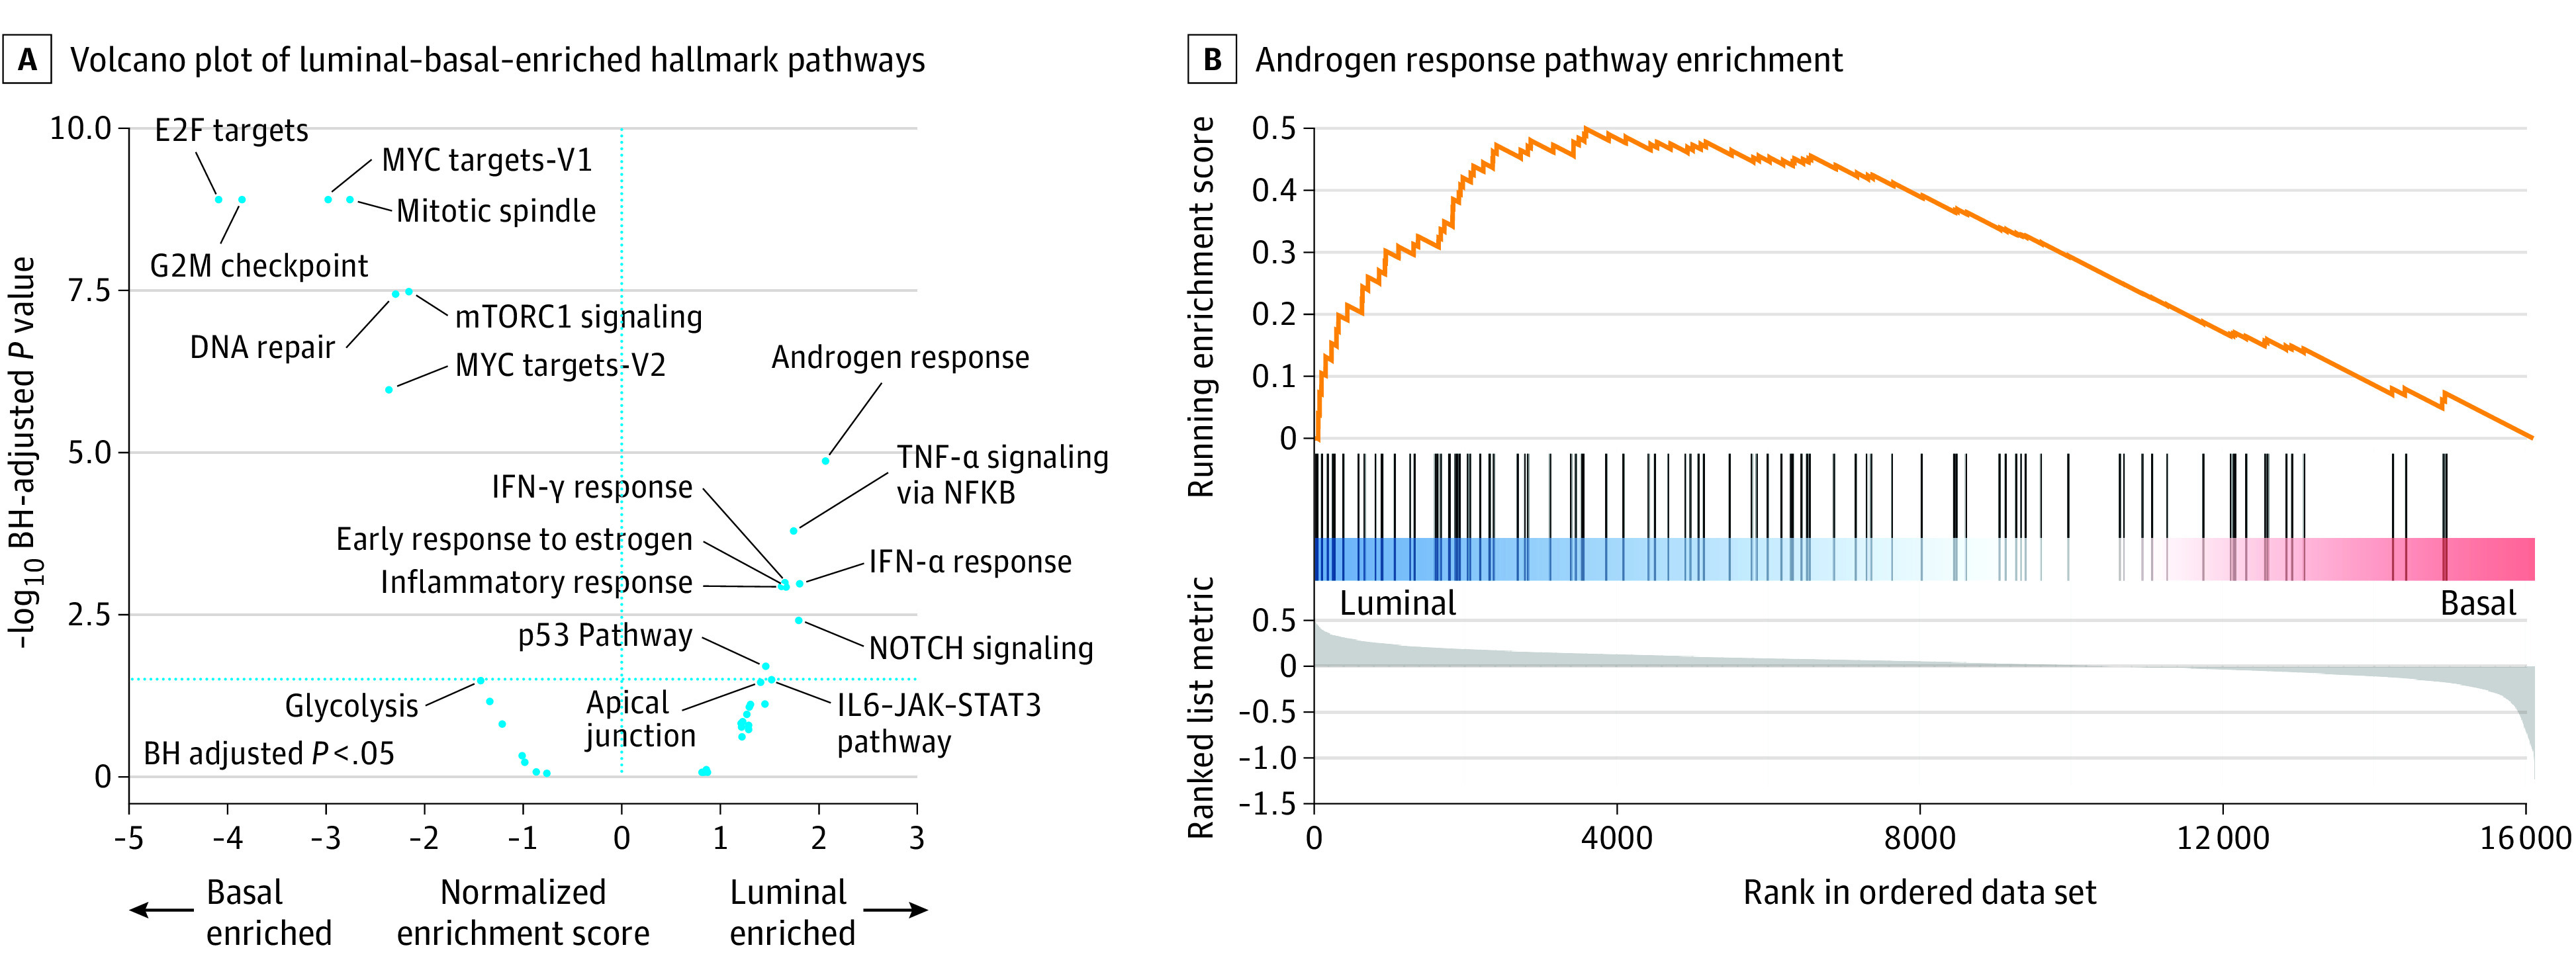
A, Gene set enrichment analysis (GSEA) was completed on the Molecular Signatures Database hallmark gene set collection, focusing on hallmark pathways involved in prostate cancer. A volcano plot of the GSEA results depicts log2 geometric mean fold change in gene expression across each gene set between basal vs luminal samples plotted against the − log10 Benjamini-Hochberg (BH)–corrected P values, to control for the false discovery rate with multiple testing. IFN-γ indicates interferon-γ; Il-6, interleukin 6; and TNF-α, tumor necrosis factor-α. The vertical dotted blue line indicates P < .05. B, GSEA enrichment plot of the androgen response hallmark pathway, showing that the androgen response pathway is positively enriched in basal samples (P < .001).