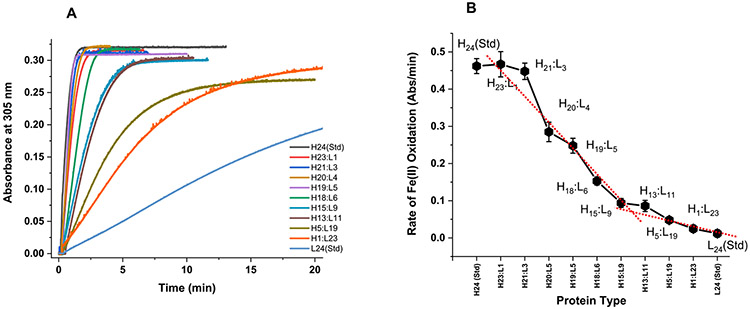
Figure 3.
Iron oxidation kinetics in ferritin at 305 nm using light absorption spectroscopy. The kinetic curves in (A) represent the formation of ferritin Fe(III) core following the addition of 500 Fe(II) ions to ferritin. The Fe(II) oxidation rates in (B) are derived from the kinetic data in (A) for the first minute of the reaction. Conditions: 0.2 μM ferritin in 100 mM Mops, 100 mM NaCl, 100 μM FeSO4, pH 7.4, 25.00 °C. The red dotted line is a linear fit to the data and shows a break at ~50:50 H:L ratio.

