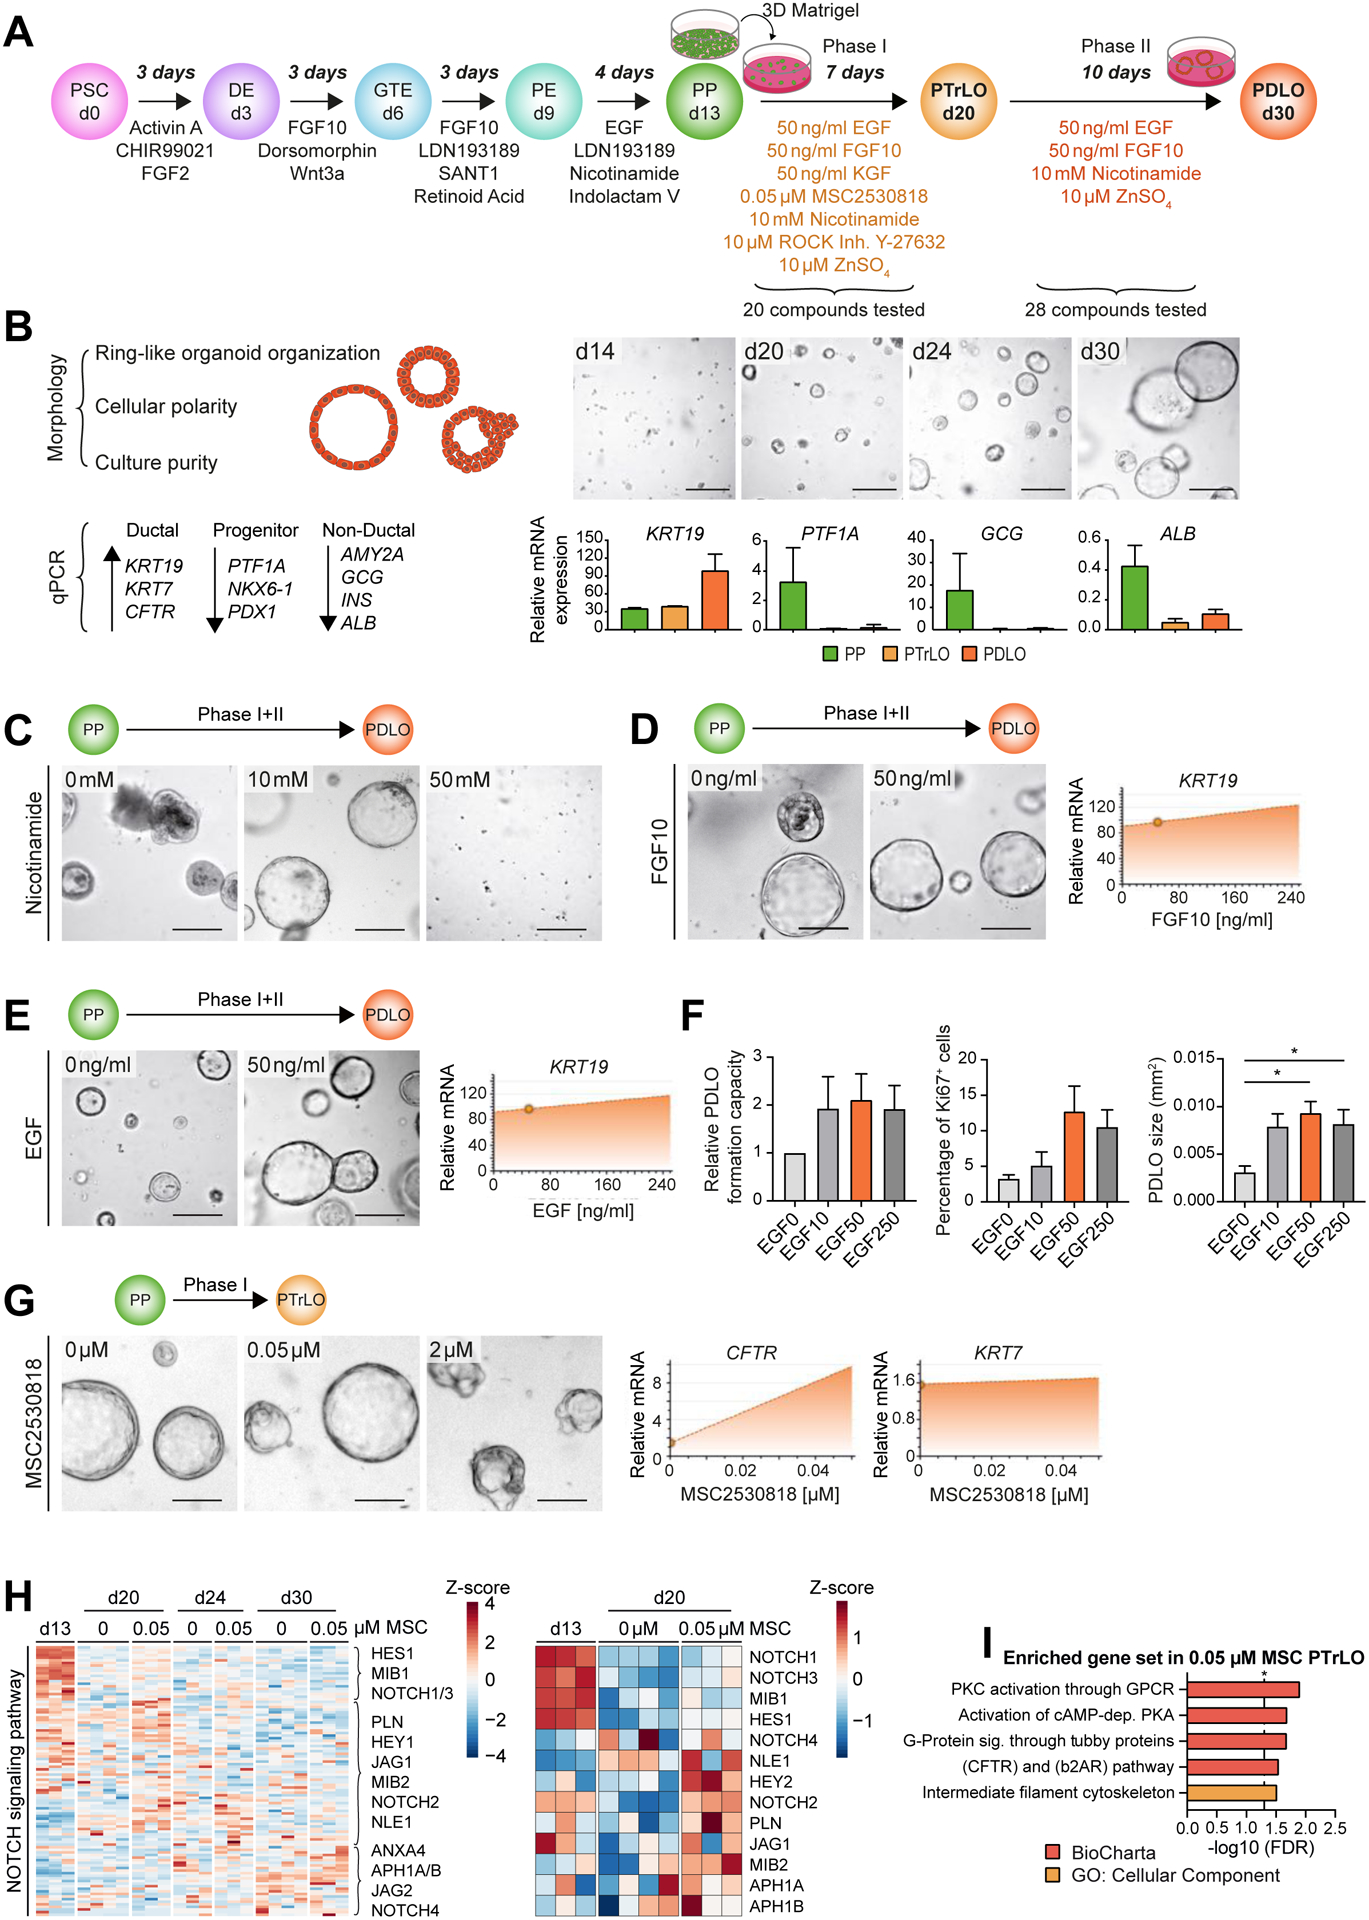
Figure 1. Engineering pancreatic duct-like organoids (PDLOs) from human pluripotent stem cells.

(A) Schematic overview of the 2-phase screening approach. Definitive endoderm (DE); gut tube endoderm (GTE); pancreatic endoderm (PE); pancreatic trunk-like organoid (PTrLO). (B) Left: Morphological criteria and marker for evaluation of duct formation. Right: Bright field (BF) images and marker profiles obtained from PP, PTrLOs, and PDLOs during differentiation; day (d). (C-E,G) BF images and dynamic marker profiles of PDLOs/PTrLOs. Compounds and screening phase as indicated. Dynamic marker profiles were interpolated from qPCR data using MODDE software and small circles indicate the applied concentration of the protocol version at the timepoint of testing. (C) Nicotinamide, (D) FGF10, (E) EGF, and (G) MSC2530818 titration. (F) Titration of EGF concentration in PDLO medium (0–250 ng/ml) and its effect on organoid growth characteristics (Mean±SEM; n=3; in duplicates, ordinary one-way Anova followed by Tukey’s multiple comparison test). (H,I) RNA-seq analysis of PPs, PTrLOs, and PDLOs with or without 0.05 μM MSC2530818 during phase I (0.00 μM: n=4, 0.05 μM: n=3). (H) Left: Plotting all identified genes from the GO term “NOTCH signaling pathway” (GO:0007219) over time. Right: Selection of genes at PP and PTrLO stage. (I) RNA-seq overrepresentation analysis of PTrLOs (d20) with 0.05 μM MSC2530818 treatment against PTrLOs (d20) without MSC. Scale bars: 100 μm. PDLO cultures were analyzed at day 30, if not stated elsewise. C,D,E, and G show data from one representative experiment in duplicates.
