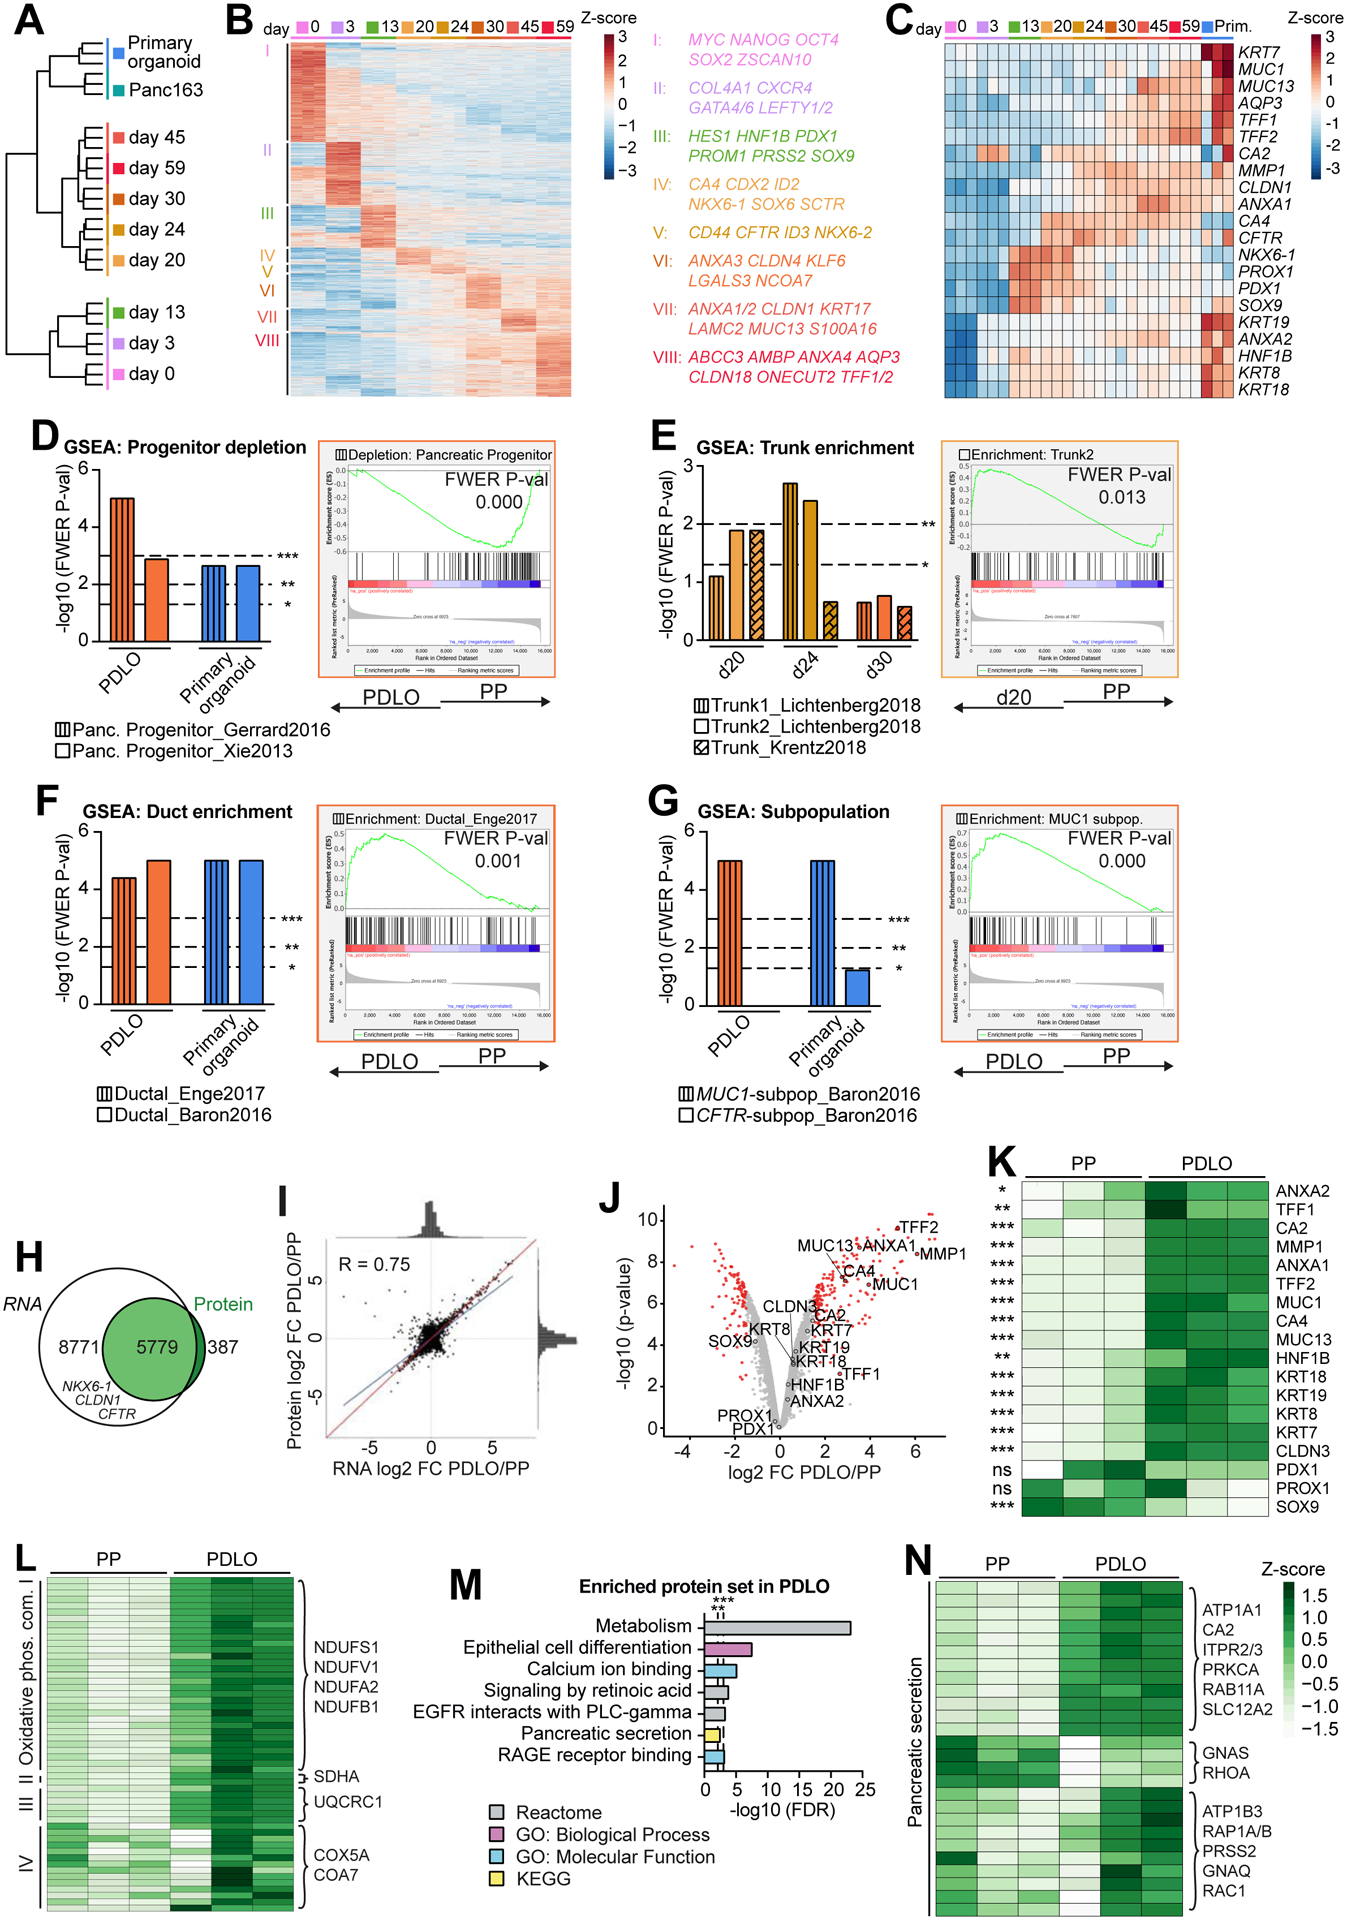
Figure 3. Global transcriptomic and proteomic analyses confirm ductal identity.

(A) Global RNA-seq data during PDLO differentiation and of patient-derived human ductal organoids (n=3). Ward clustering was performed with all processed genes. (B) Heatmap of stage-specific significant genes. (C) Temporally resolved heatmap of key progenitor and ductal genes. (D-G) Gene Set Enrichment Analysis (GSEA) of d20, d24, PDLOs (d30), and primary ductal organoids against PPs (d13) for distinct reference gene sets. Exemplary GSEA plots are highlighted in respective sample colors. (H) Venn diagram representing the overlap of transcripts measured by RNA-seq with proteins detected by mass spectrometry (n=3). (I) Pearson correlation of RNA-seq and proteome log2FC of PDLOs (d59) versus PPs (d13). The blue line indicates actual correlation, the red line ideal correlation of all 5779 shared genes/proteins. (J) Volcano plot of protein mass spectrometry data of PDLOs and PPs. Differentially regulated proteins in red (P-value ≤ 0.01 and FC ≥ |1.5|). (K) Heatmap of key progenitor and ductal proteins in PPs and PDLOs. (L,N) Heatmap illustration of proteins (L) from the four “Oxidative phosphorylation” complexes and (N) the KEGG term “Pancreatic Secretion”. (M) Enriched protein sets in PDLOs over PPs.
