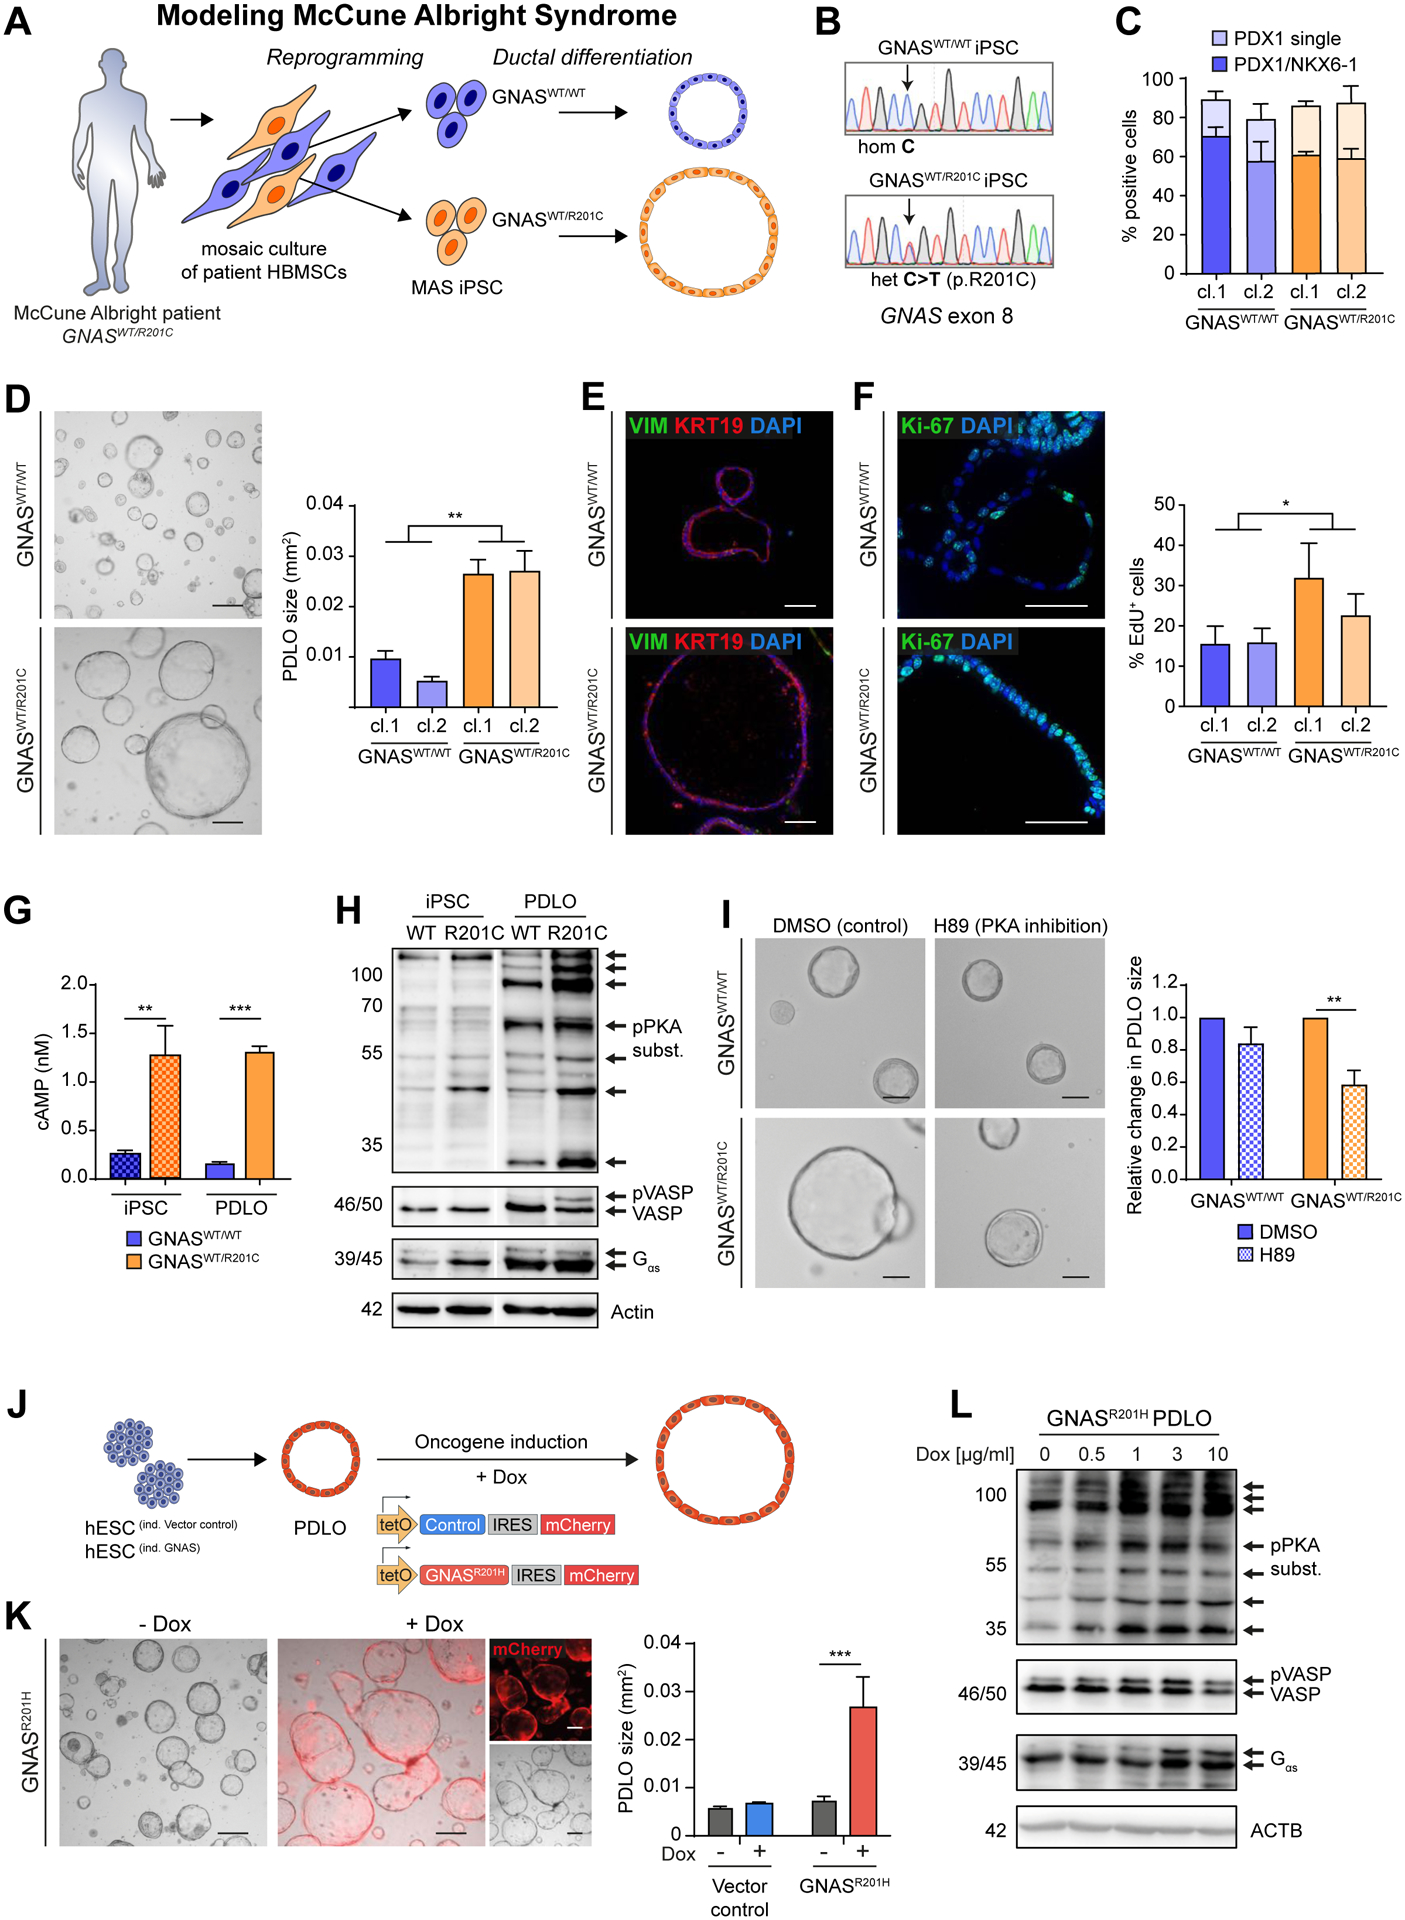
Figure 6. McCune-Albright syndrome-derived and GNASR201H overexpressing PDLOs form large cysts.

(A) Scheme of generating isogenic iPSC lines from a MAS patient carrying a mosaic GNASWT/R201C mutation followed by PDLO formation. (B) Sequencing results of selected iPSC clones. (C) FC-based PP quantification after differentiation of GNASWT/WT and GNASWT/R201C MAS-iPSCs (n=3; cl.: clonally derived iPSC line). (D) BF PDLO images from MAS-iPSCs. Right: Size comparison. (E) VIM and KRT19 IF staining of MAS-PDLOs. (F) Ki-67 IF staining (left images) and FC analysis after EdU-treatment (right) showed increased proliferation of GNASWT/R201C PDLOs. (G) Analysis of cAMP levels in MAS-iPSC and PDLO cells (n=1; in triplicates). (H) WB showing increased PKA signaling in GNASWT/R201C PDLOs. iPSC and PDLO samples shown separately were detected on the same blot, image was cropped due to additional loaded samples (n=1). (I) Representative BF images of MAS-iPSC-derived PDLOs treated with PKA inhibitor H89 or DMSO for 9 days. Right: Size quantification of PDLOs upon inhibition of PKA signaling (n=3). (J) Timed induction of a piggyBac GNASR201H transposon construct in engineered HUES8. (K) BF images of GNASR201H PDLO cultures after 7 days on Dox. (red: mCherry signal). Right: PDLO size quantification (n=3; in triplicates). (L) Dox concentration-dependent increase of PKA-signaling in PDLOs after Dox treatment for 3 days. Scale bar: 200 μm, if not stated elsewise. Mean±SEM; D,F: n=6 experiments per group (3 per individual clone), Mann-Whitney test. G: Ordinary one-way Anova with Tukey’s multiple comparison test. I,K: Ordinary two-way Anova with Sidak’s multiple comparison test; only significant comparisons are depicted.
