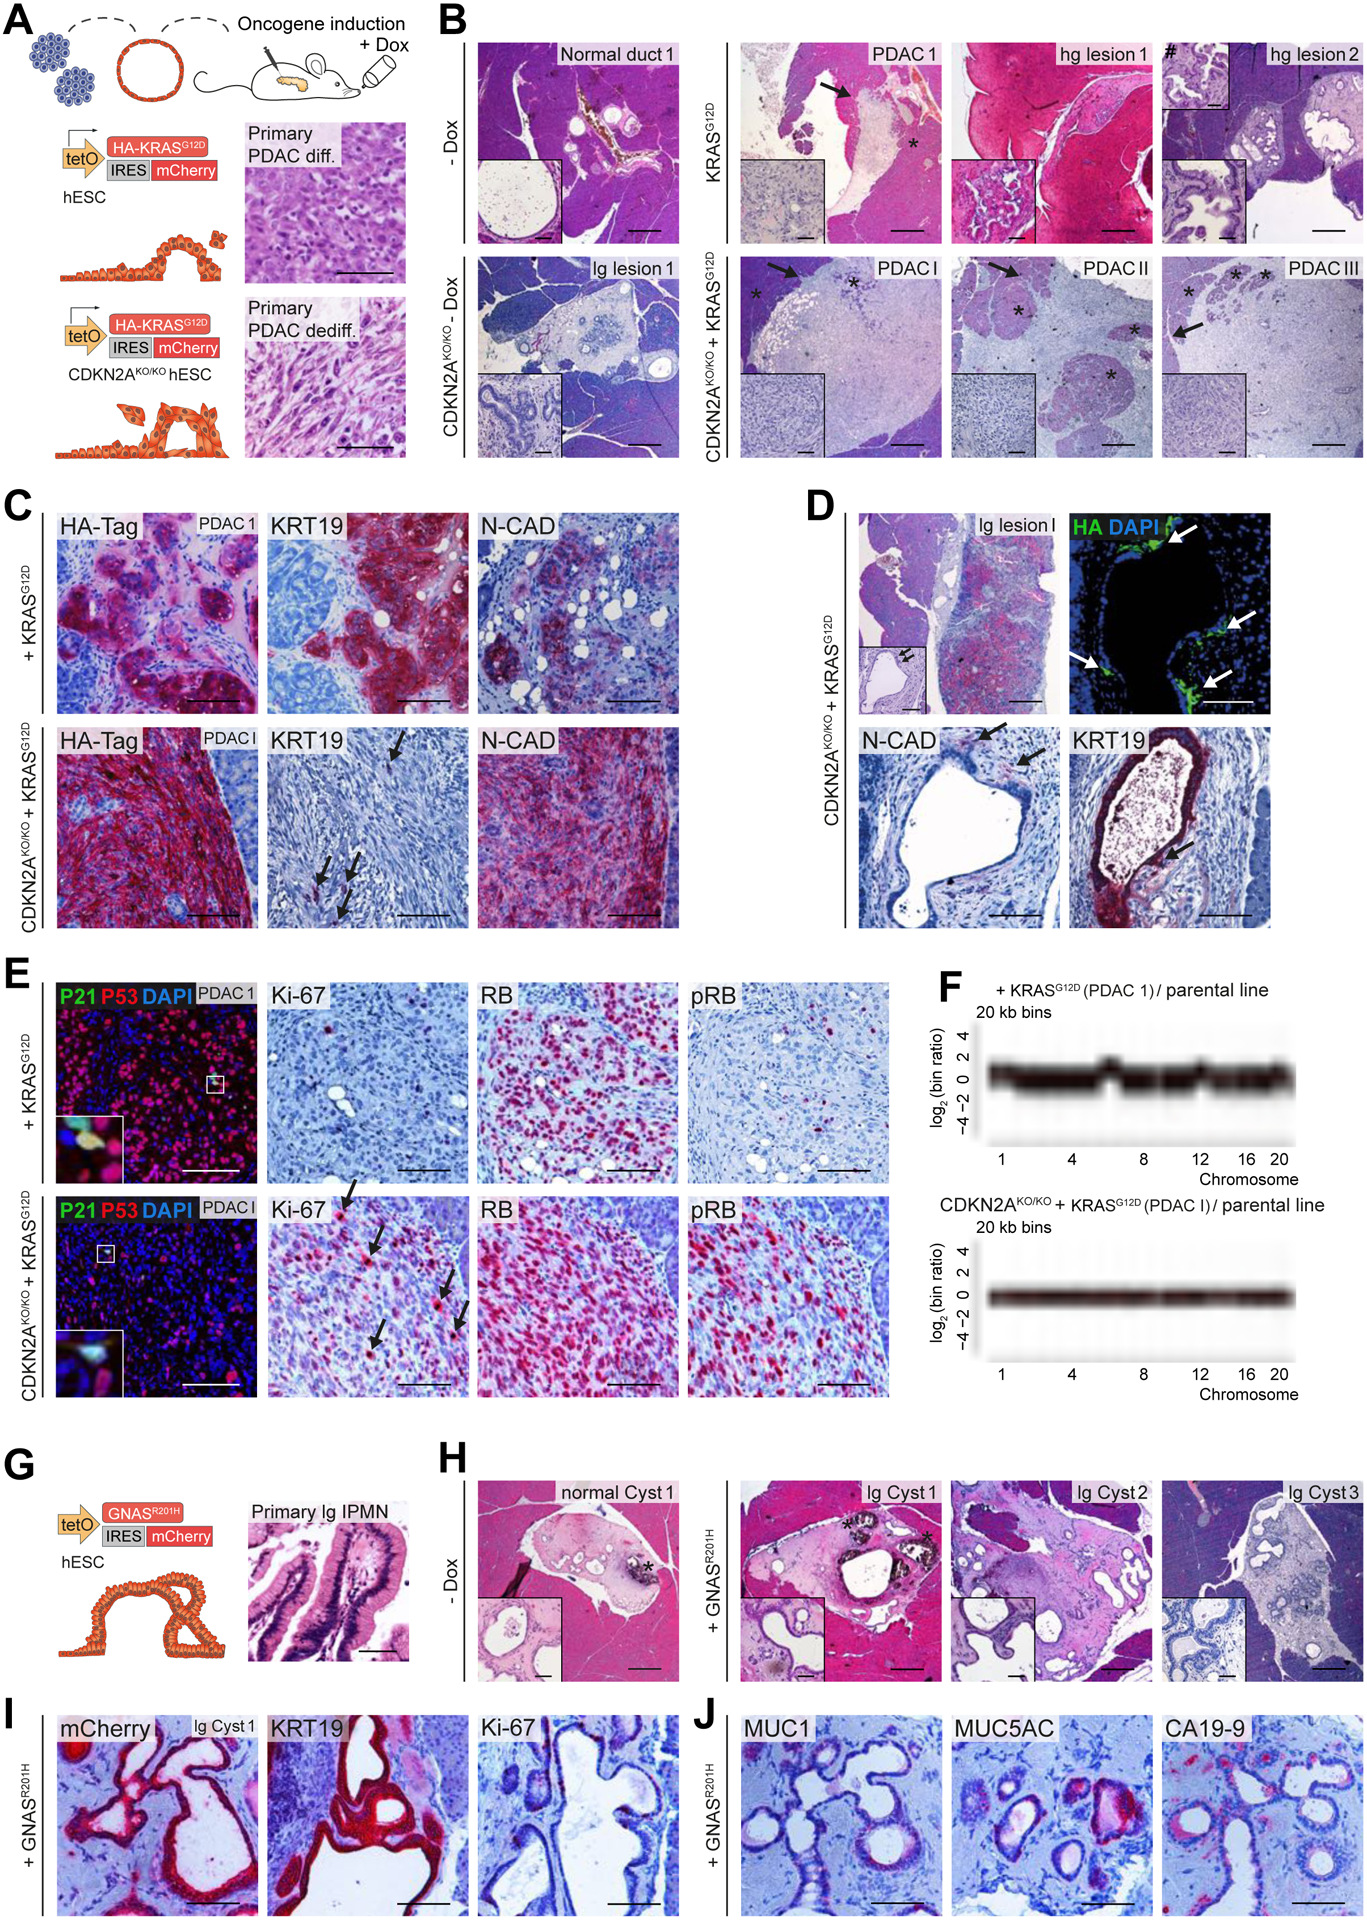
Figure 7. Mutation-dependent PDAC- or IPMN-like tumor formation from PDLO grafts.

(A) Schema of orthotopic PDLO transplantations. Oncogene expression was induced in vivo for 8 weeks. Reference images of HE staining of primary PDAC patient tissue are depicted for illustration. (B) HE overview images of grafts that developed from KRASG12D and CDKN2AKO/KO KRASG12D PDLOs with and without oncogene induction (lg/hg lesion, low-grade/high-grade preneoplastic lesion). Asterisks label murine pancreas tissue, arrows indicate invasive tumor growth, hashtag marks a second inset from a different section of the same graft, demonstrating a higher grade of cellular atypia. See Suppl.Fig7A for number of transplanted mice. (C) IHC staining showing that KRASG12D induction (reflected by HA-Tag) alone led to differentiated PDAC, and CDKN2AKO/KO KRASG12D to dedifferentiated PDAC. Arrows highlight single epithelial cells in the CDKN2AKO/KO KRASG12D graft. (D) One specific CDKN2AKO/KO KRASG12D graft with heterogenous transgene induction. Sites of dissemination and EMT correlate with HA-tag expression (indicated by arrows). (E) Staining of cell cycle-associated proteins. Few P21 positive cells. RB/pRB staining indicated an intact checkpoint control in KRASG12D tumors, but nearly complete loss of active RB in CDKN2AKO/KO KRASG12D grafts resulting in increased proliferation (Ki-67) in CDKN2AKO/KO KRASG12D grafts. Arrows highlight several mitoses in the CDKN2AKO/KO KRASG12D graft. (F) lcWGS of PDLO-derived tumors. (G) Schema and reference HE image of primary patient IPMN tissue. (H) IPMN-like lesion formation observed after GNASR201H induction in vivo. HE overview of low-grade cystic GNASR201H grafts and control without Dox treatment. Asterisks label disrupted Matrigel, observed in few grafts. See Suppl.Fig7A for number of transplanted mice. (I,J) IHC staining indicating IPMN formation after GNASR201H induction (confirmed by mCherry expression). Scale bar: 100 μm, except for HE staining in B,D,H: 500 μm; in insets: 50 μm.
