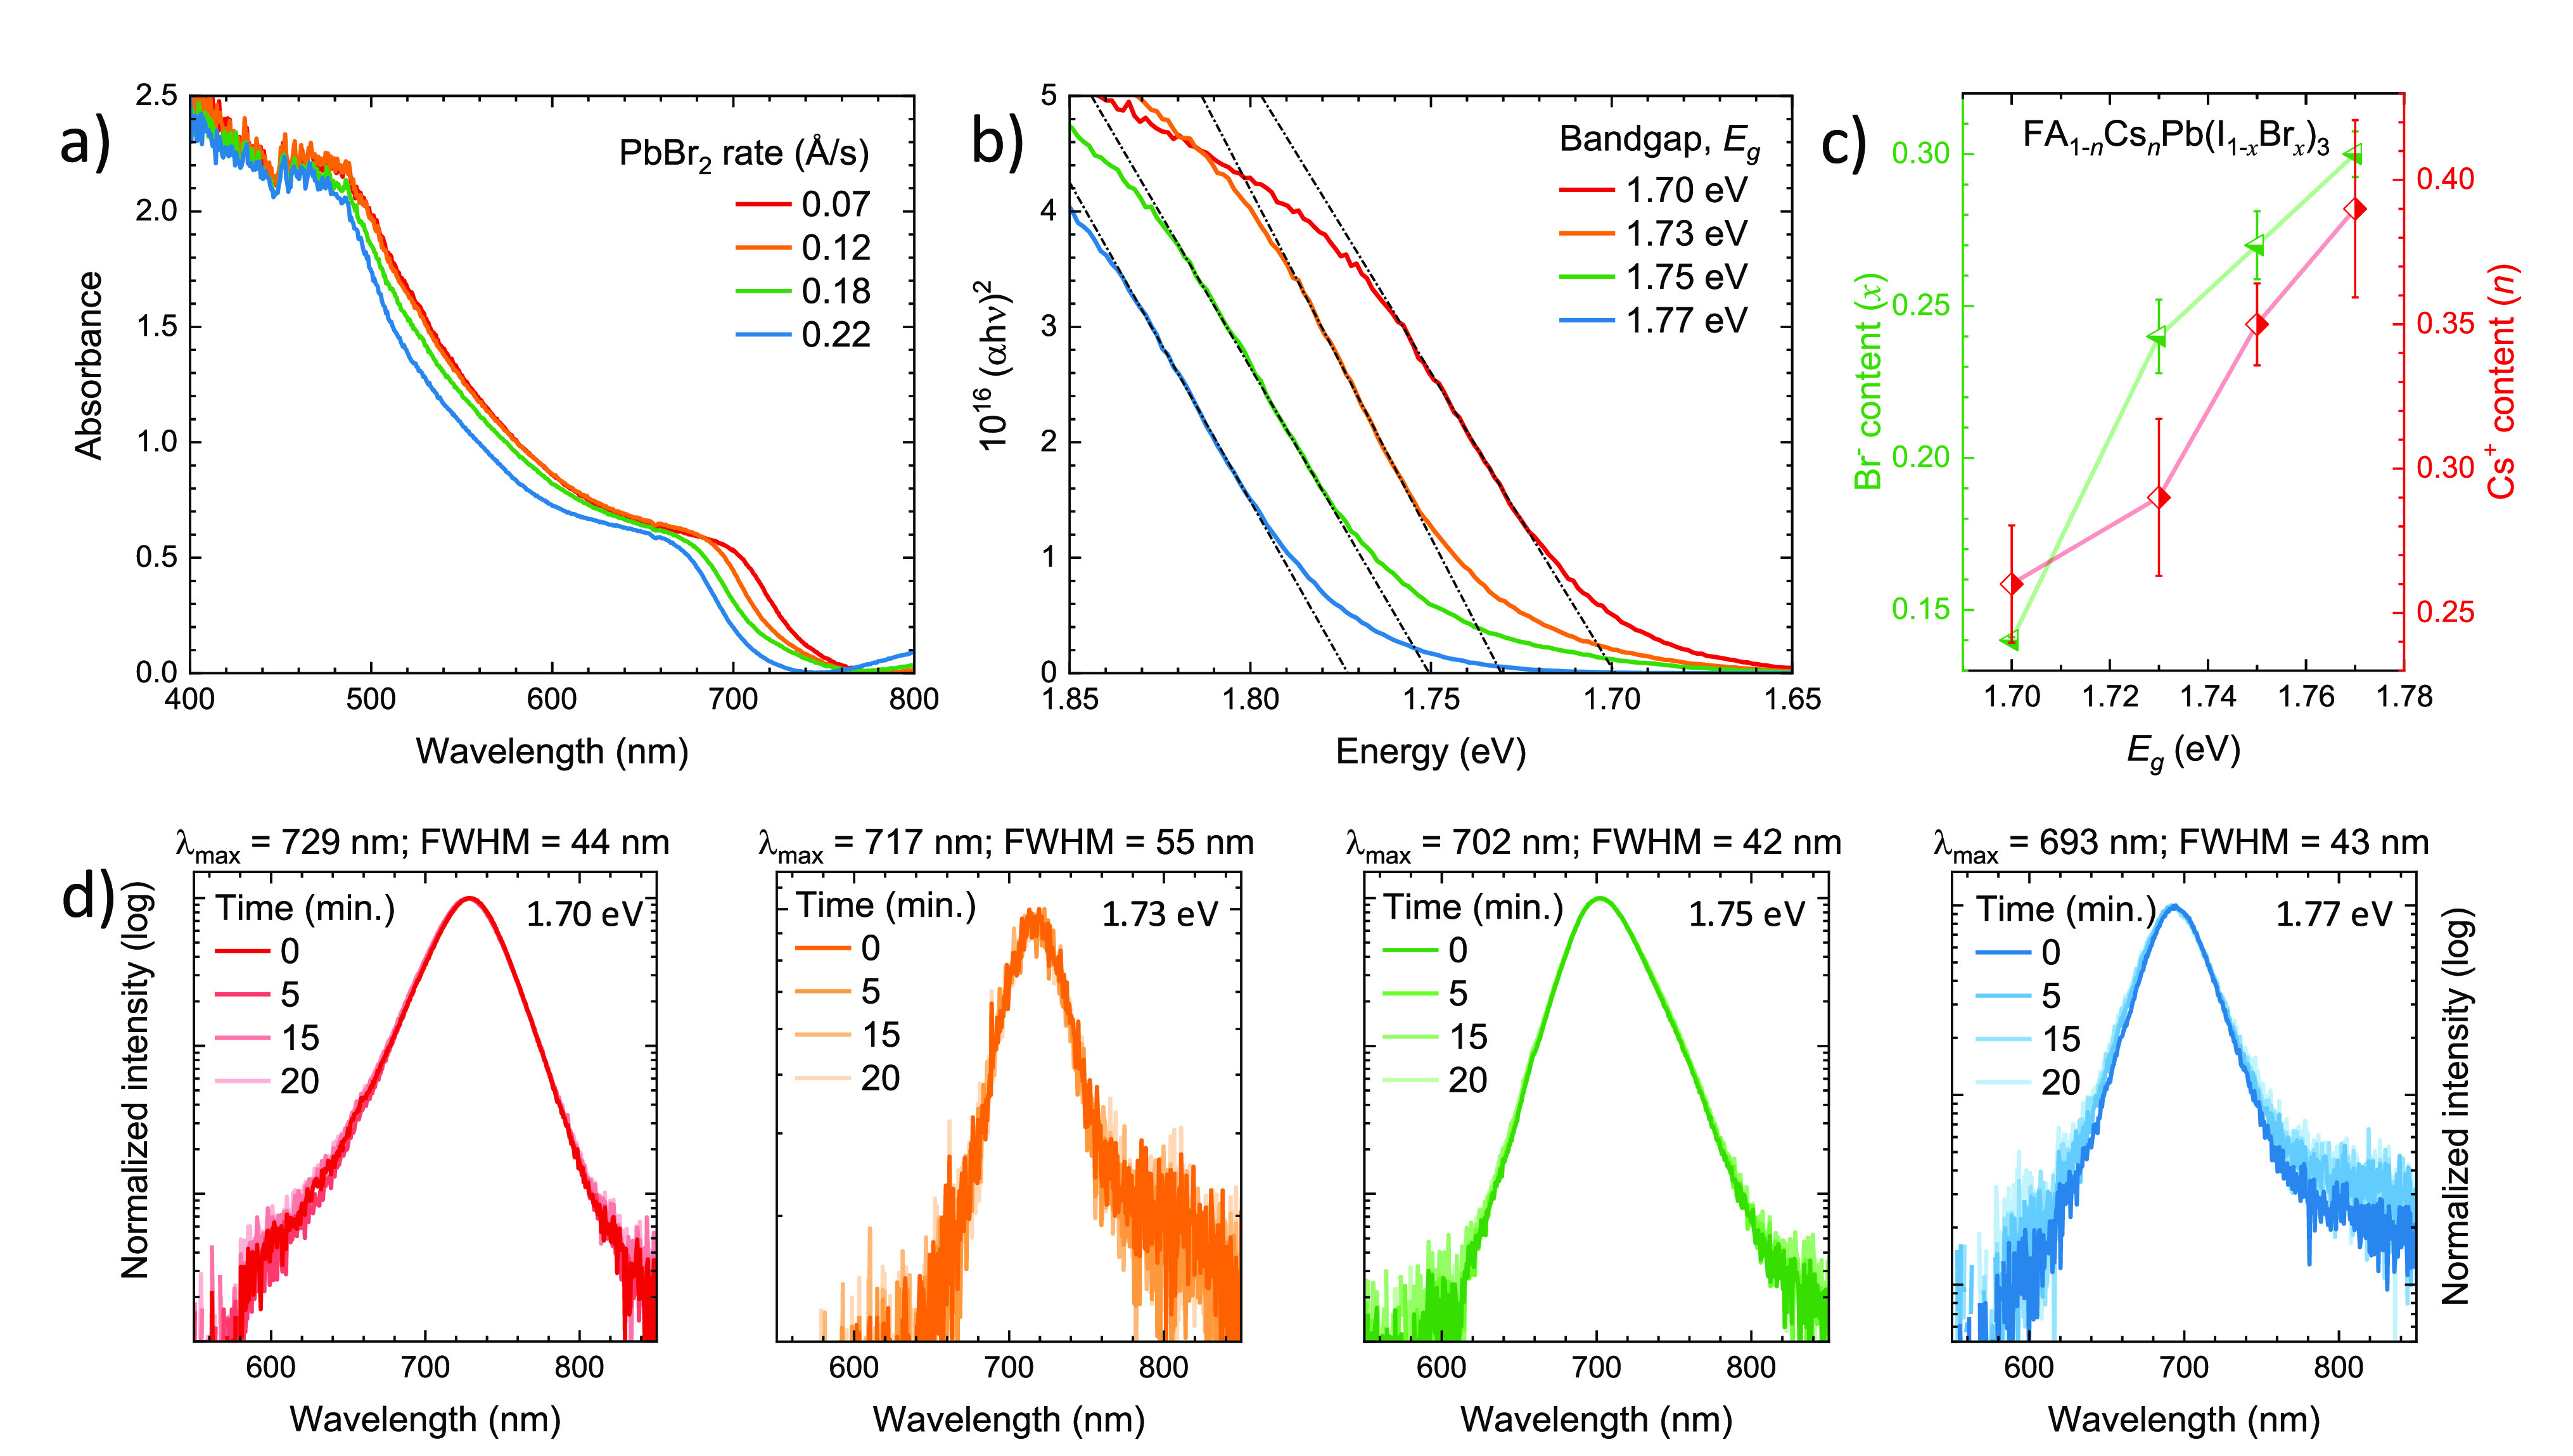
Figure 1.

(a) Absorbance spectra of a series of FA1–nCsnPb(I1–xBrx)3 perovskite films obtained with increasing PbBr2 deposition rate and (b) corresponding Tauc plot and estimated bandgap energies (Eg). The film thickness is 500 nm for all samples. (c) Bulk bromide (left, green) and cesium (right, red) content in the perovskite films estimated by energy dispersive X-ray spectroscopy (EDS). Error bars are the standard deviation of measurements obtained from films of different deposition runs. (d) Normalized photoluminescence (PL) spectra of the same samples recorded over time (up to 20 min) under continuous illumination. The excitation source is a green laser (515 nm) with an irradiance of approximately 300 mW/cm2.
