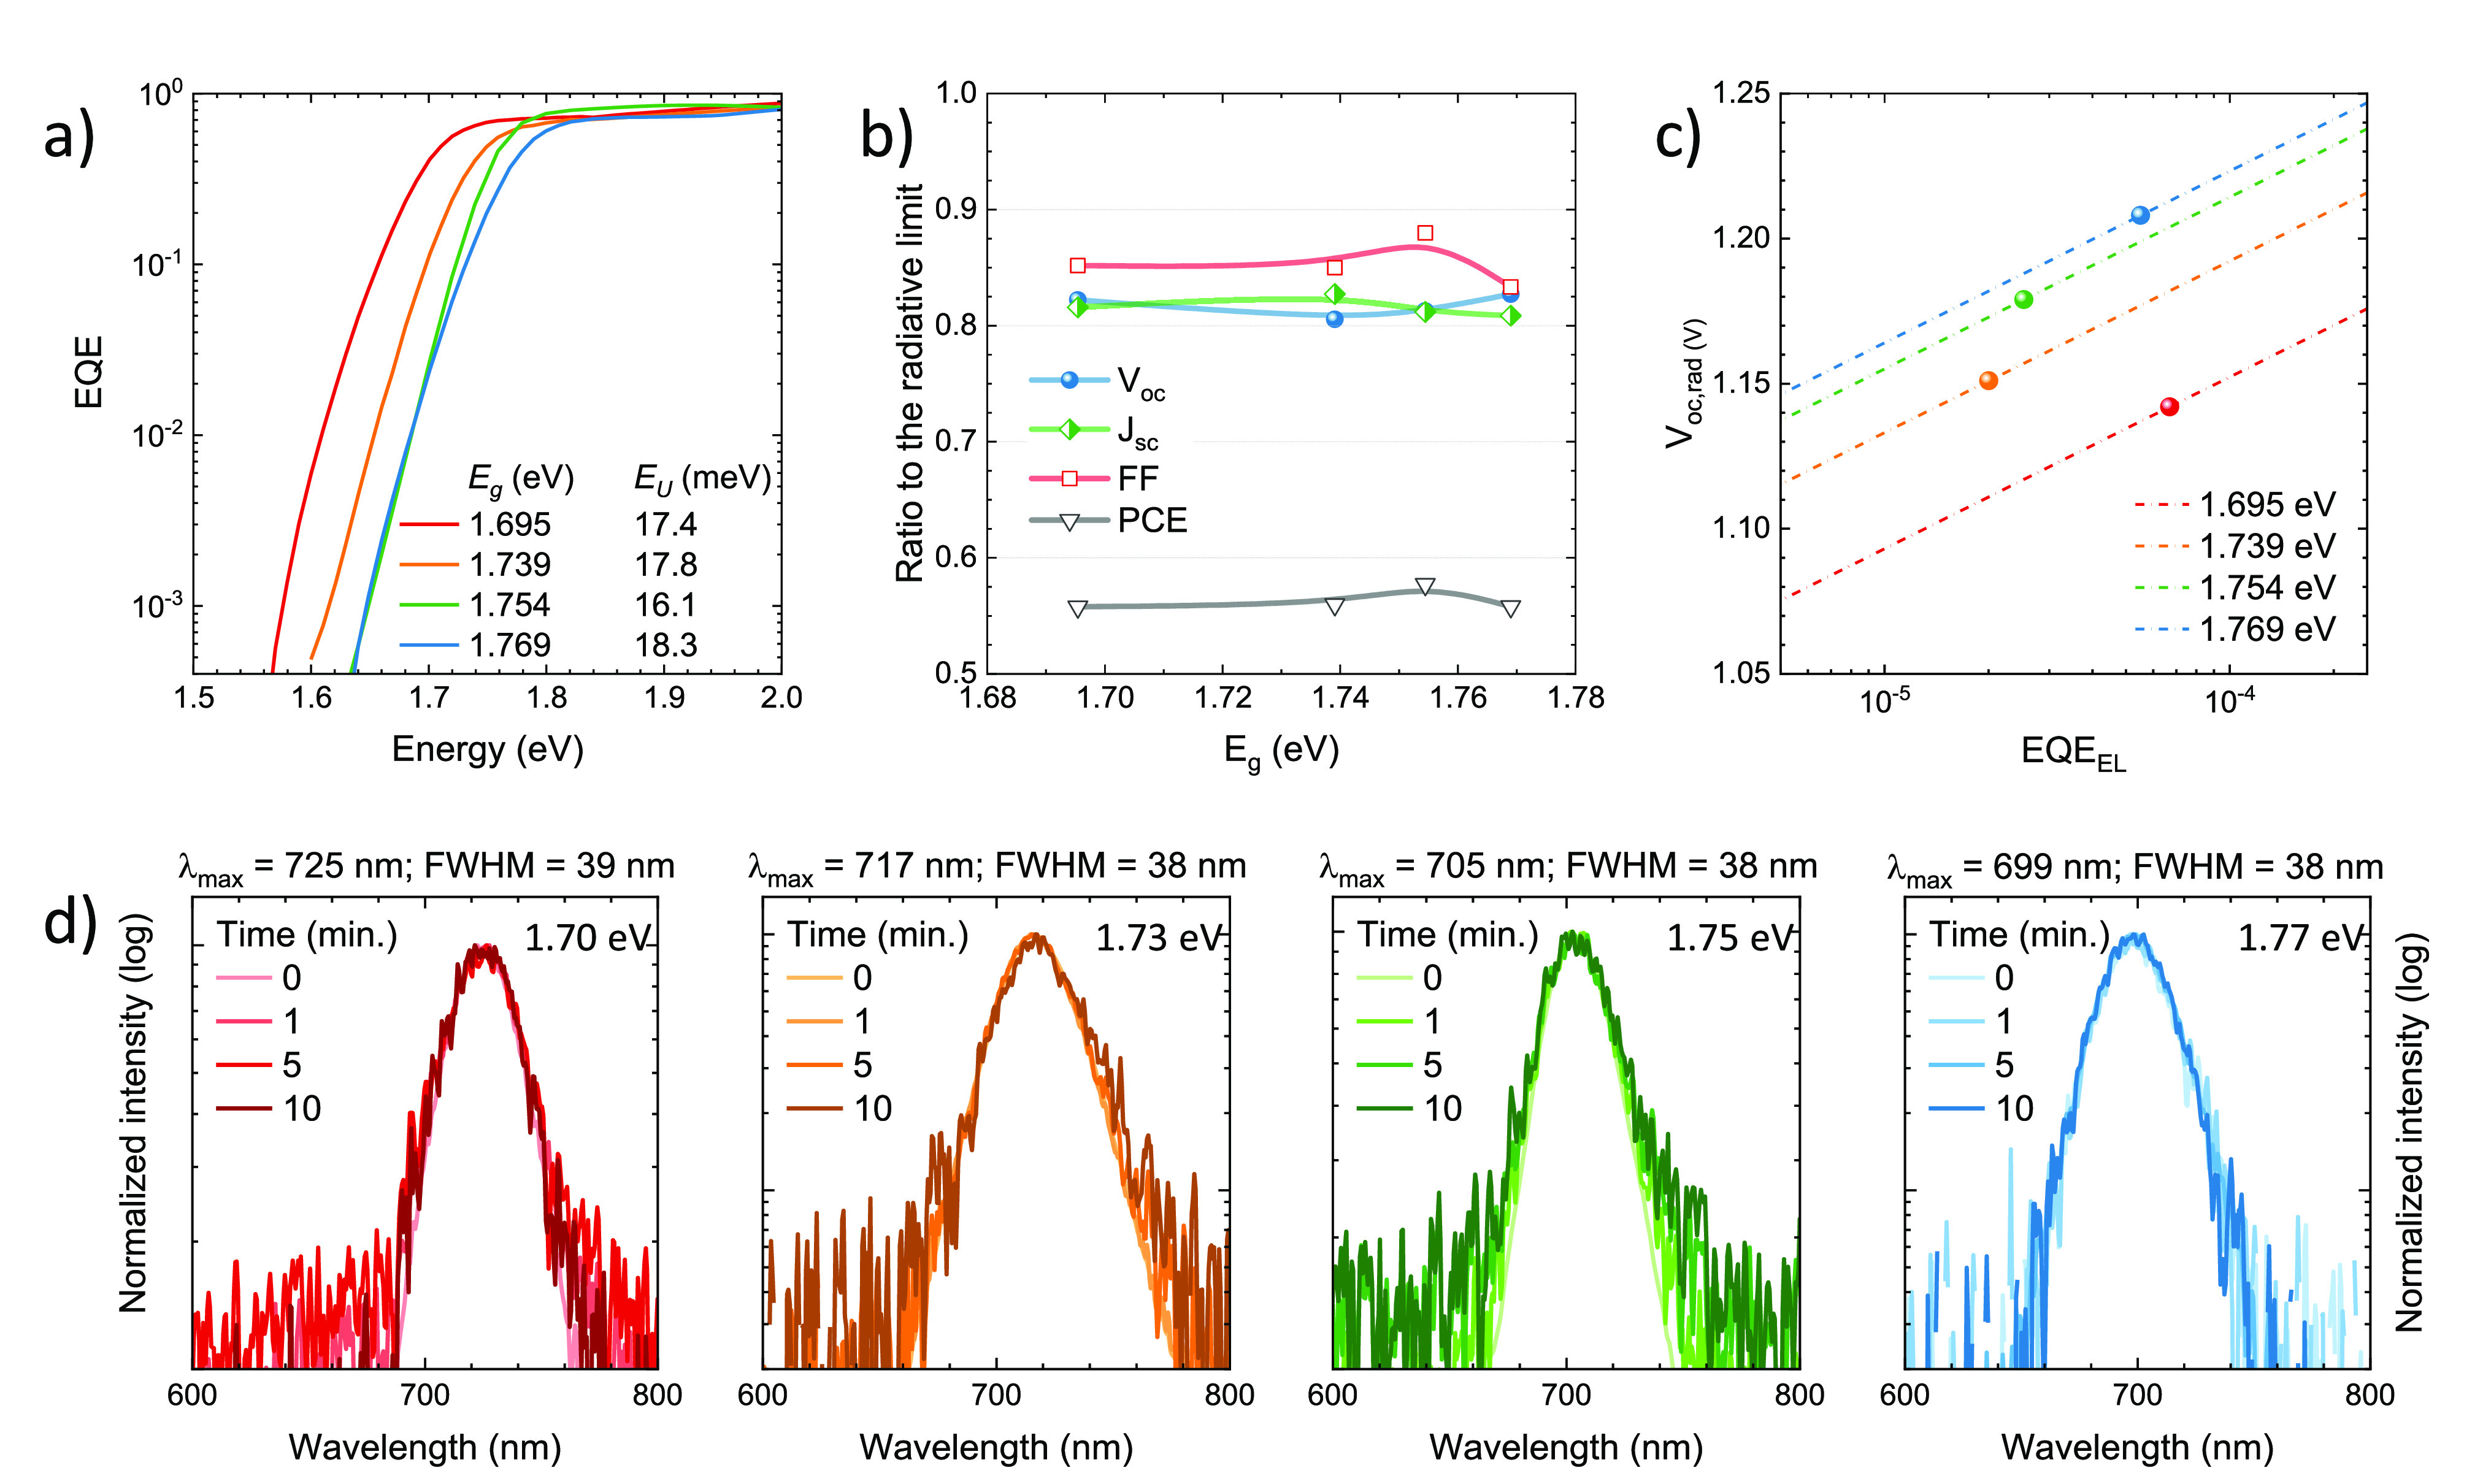
Figure 4.

Optoelectronic analysis of FA1–nCsnPb(I1–xBrx)3 solar cells with different bandgaps. (a) Sensitive EQE spectra in the bandgap region and calculated bandgap and Urbach energies. (b) Ratio of measured Voc, Jsc, and FF to their maximum theoretical (radiative) limit (lines are guides to the eye). (c) Relation between the open-circuit voltage in the radiative limit with the electroluminescence quantum efficieny, EQEEL.of a solar cell (lines) for the four bandgaps studied here. Symbols shows the measured Voc, allowing the corresponding EQEEL to be estimated. (d) Electroluminescence (EL) spectra of the same samples recorded over time (up to 10 min) under continuous forward bias. Each cell was driven with a constant current-density equal to the Jsc obtained under simulated solar illumination.
