
Figure 1.
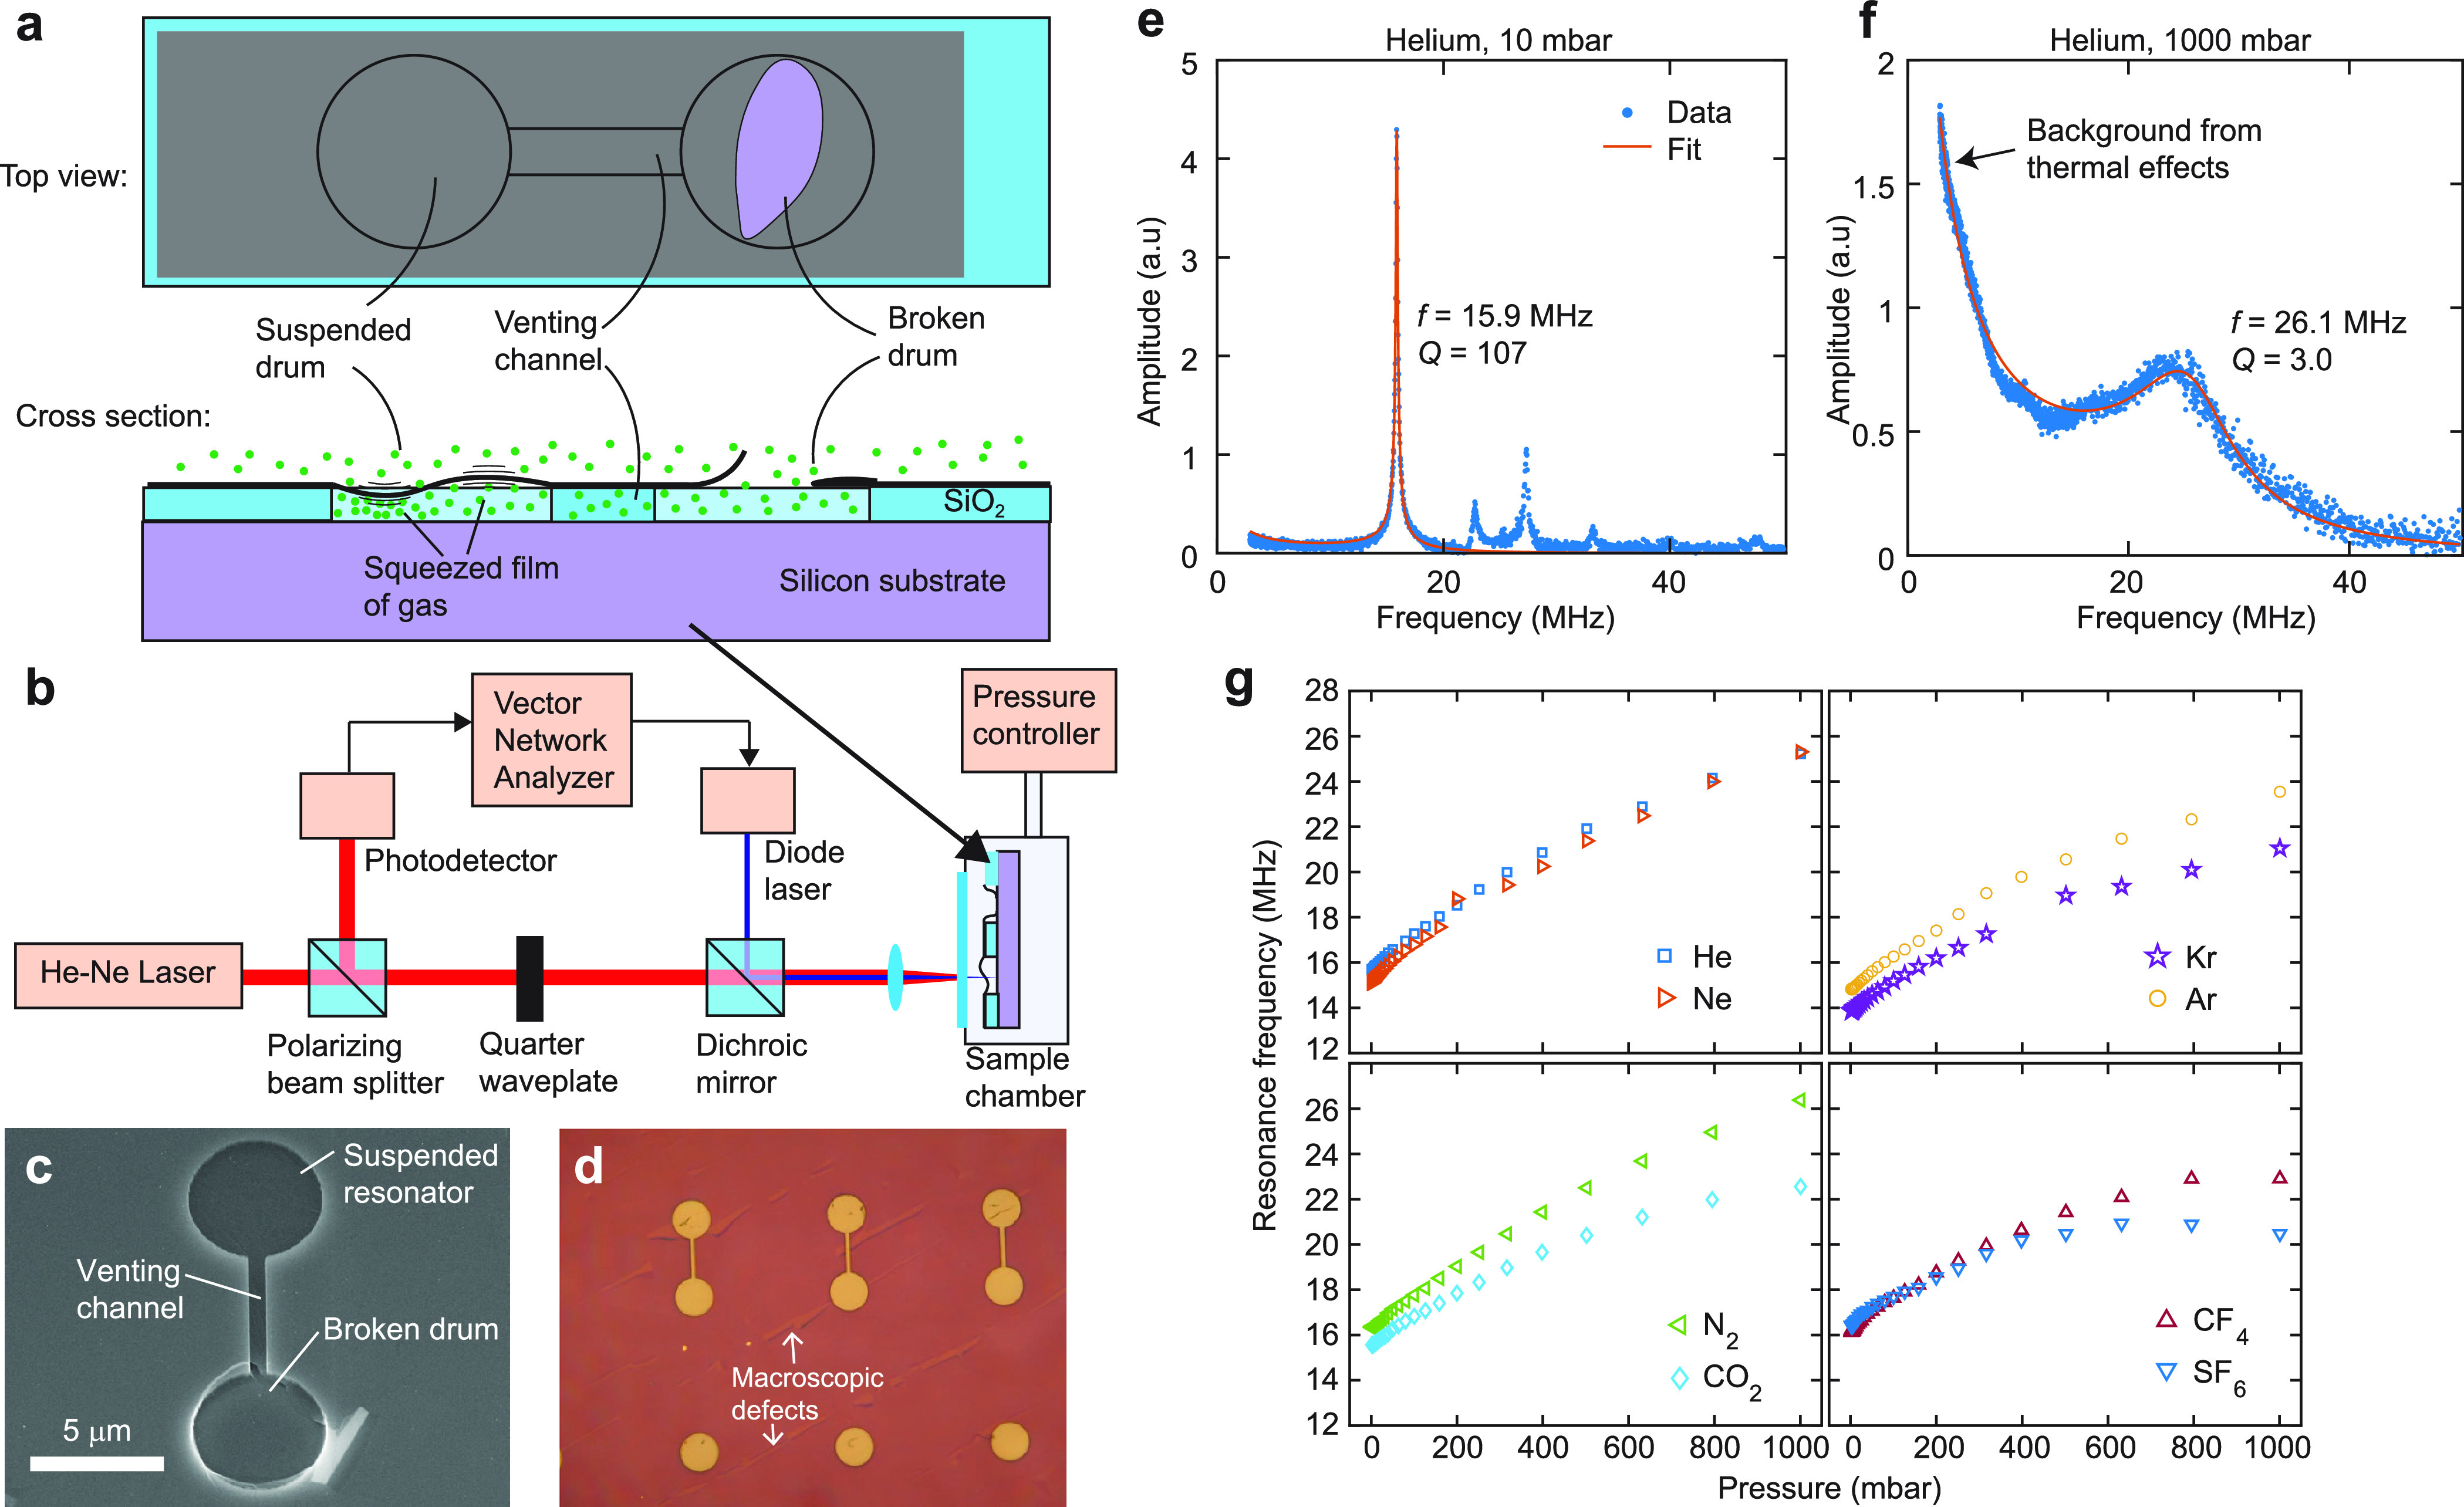
Graphene samples used in the experiment and the experimental setup to actuate and detect their motion. (a) Top view and cross-sectional view of a graphene resonator on a dumbbell-shaped cavity. The cross-sectional view shows a schematic drawing of the resonator’s motion, highlighting where compression of the gas occurs due to the squeeze-film effect. (b) Interferometric setup used to actuate and detect the motion. (c) Scanning electron microscopy image of a representative device used in this study. The bottom half of the dumbbell is broken, while the top half is whole. (d) Optical microscopy image of a part of the chip, showing the coverage of graphene over the chip’s surface and the macroscopic defects which helps one part of the dumbbell to break. (e) Measured amplitude of motion for a 5 μm diameter membrane as a function of frequency in a 10 mbar helium environment, and a fit (red lines) to the first resonance peak and the low-frequency background using the procedure described in Supporting Information section S1. The measured amplitude is corrected for any delays in the electronic components of the experimental setup. (f) Same as (e), but at a higher pressure of 1000 mbar. The background at low frequencies originates due to thermal effects, as explained in Supporting Information section S1. (g) Pressure-dependent resonance frequency for 8 different gases measured on a 5 μm diameter drum.