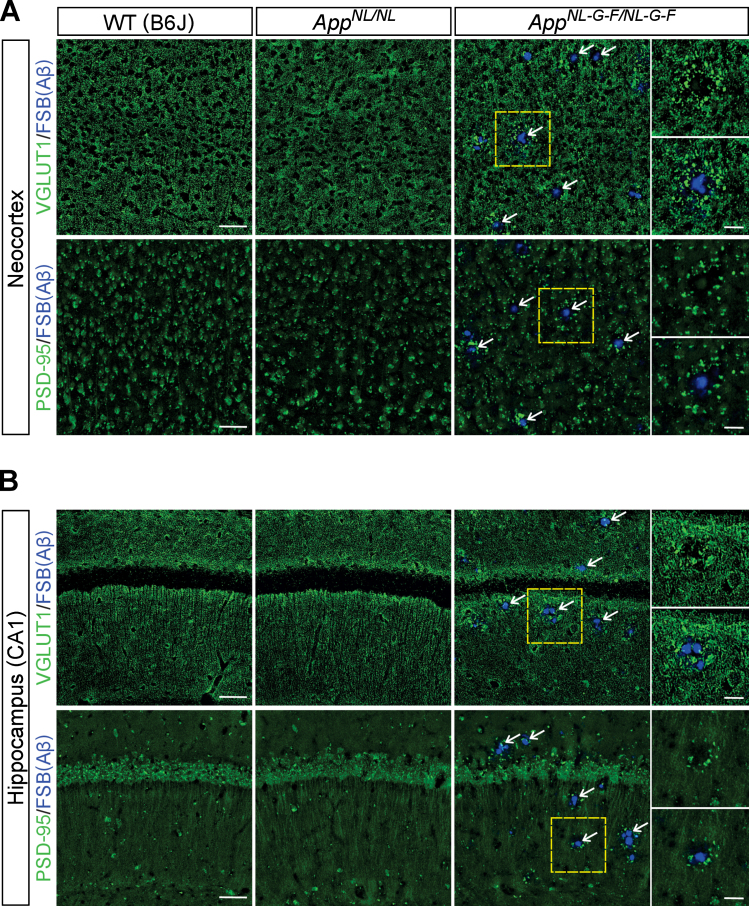
Fig. 5.
Loss of glutamatergic synapses is associated with the vicinity of Aβ plaques. A, B) Representative images of the neocortex (A) and hippocampal CA1 subfield (B) from frozen coronal brain sections immunostained with anti-VGLUT1 and anti-PSD-95 antibodies (indicated by green in A and B) were shown. FSB was used for detecting Aβ plaques (indicated by blue in A and B). White arrows point to representative examples of Aβ plaque. Insets show higher-magnification views in the corresponding dashed yellow squares. Scale bars represent 50μm. In the inset images, scale bars represent 20μm. n = 3/genotype.

