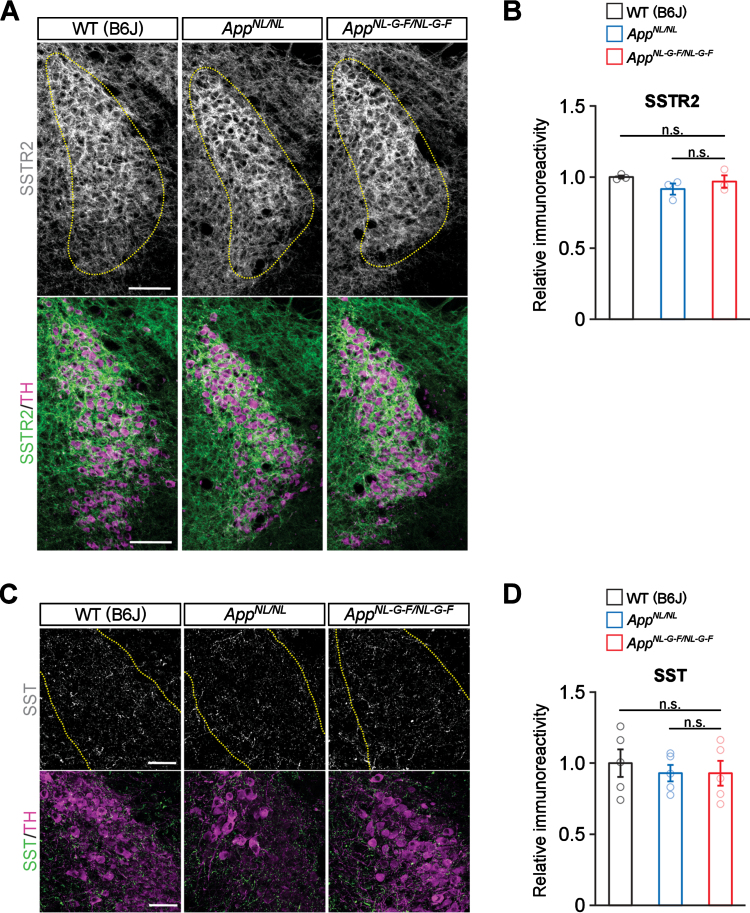
Fig. 6.
No prominent reduction of somatostatin and somatostatin receptor 2 are detected in the LC. A) Representative images of the LC from frozen coronal brain sections immunostained with anti-SSTR2 (indicated by gray for single color images or green for multicolor images) and anti-TH (indicated by magenta for multicolor images) antibodies were shown. Scale bar represents 100μm. B) SSTR2 immunoreactivity in the TH-positive LC region (indicated by yellow dotted lines) was evaluated and expressed as a relative ratio to WT (B6J). C) Representative images of the LC from frozen coronal brain sections immunostained with anti-SST (indicated by gray for single color images or green for multicolor images) and anti-TH (indicated by magenta for multicolor images) antibodies were shown. Scale bar represents 50μm. D) SST immunoreactivity in the TH-positive LC region (indicated by yellow dotted lines) was evaluated and expressed as a relative ratio to WT (B6J). n = 3–5/genotype. n.s., not significant.

