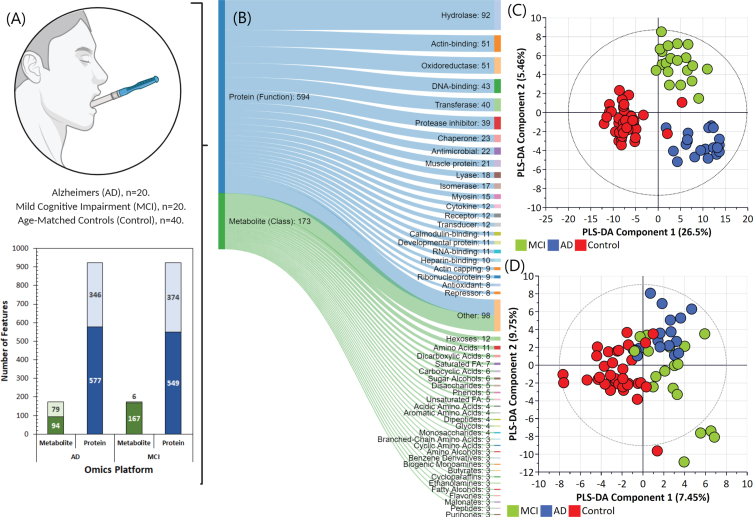
Fig. 1.
Omics analysis data overview. A) Saliva sample group summary and the number of metabolite and protein features identified and found to be statistically significant in the Alzheimer’s disease (AD) and mild cognitive impairment (MCI) groups compared to the control group. B) Overview of proteins and metabolites classified based on chemical ontologies and structural similarity and function. Partial least squares-data analysis (PLS-DA) score scatter plots for the (C) proteomics and (D) metabolomics datasets.

