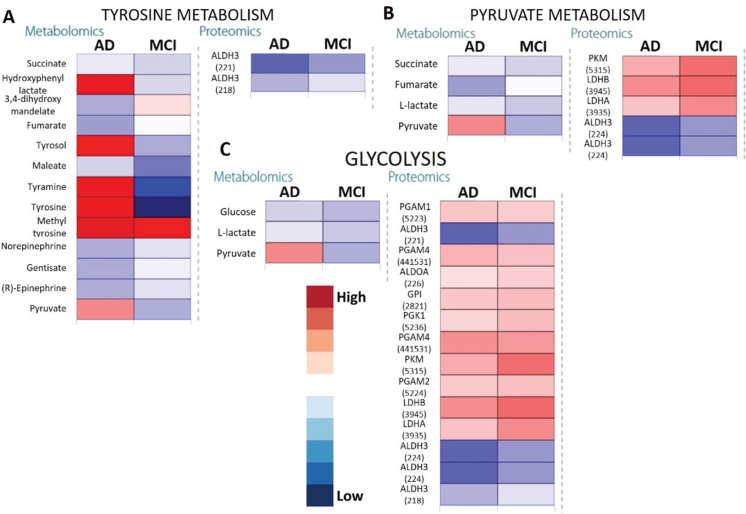
Fig. 4.
Heatmaps showing metabolomic and proteomic expressions during (A) Tyrosine metabolism, (B) Pyruvate metabolism, and (C) Glycolysis in the salivary matrix of AD and MCI patients with respect to control representatives (non-AD/MCI patients). The metabolites and proteins used in the multi-omics integration were selected based on the fold changes (Log2FC≥1.00 or Log2FC≤–1.00) with statistically significant differences False discovery rates (FDR≤0.05)). Note: The numerical IDs in parenthesis indicate Entrez Gene IDs of the proteins involved in these pathways.

