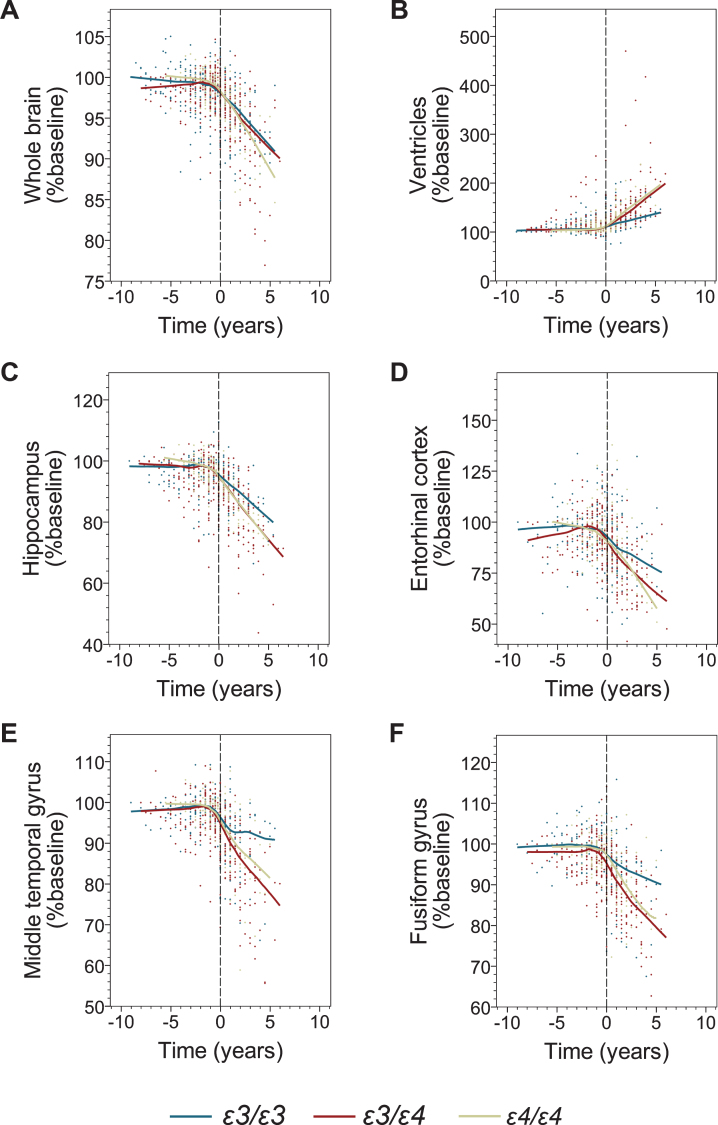
Fig. 2.
The effect of the APOE genotype on brain volumetric measures before and after transition to AD dementia. Shown are individual data points and locally estimated scatterplot smoothing (LOESS) regression with 70% smoothing and uniform distribution for the following volumetric measures: the whole brain (A), the ventricular system (B), the hippocampus (C), the entorhinal cortex (D), the middle temporal gyrus (E), and the fusiform gyrus (F). Negative and positive values on the abscissa depict number of years before and after transition from MCI to AD dementia. Values on the ordinate represent percent of the baseline volume calculated at the initial ADNI enrolment visit.

