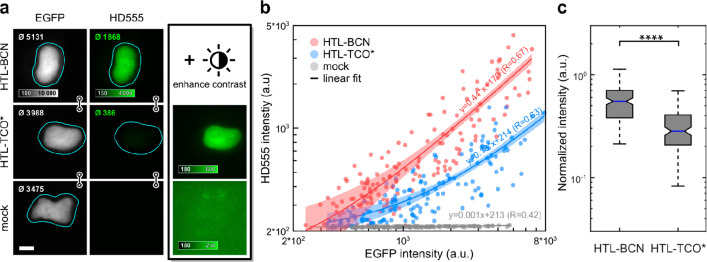
Figure 3.
Fluorescence intensity quantification of HD555 in live cells. COS-7 cells expressing H2B-EGFP–HaloTag labeled with HD555 via HTL–BCN or HTL–TCO* and a mock control omitting any HaloTag linker. (a) Representative epifluorescence microscopy images of cells with comparable expression levels as indicated by mean intensities in segmented nuclei (top left corner of each image). The HD555 channel is shown at identical display settings (indicated by linked images) and with enhanced contrast. (b) Mean nucleus intensities of 151 (HTL–BCN), 145 (HTL–TCO*), and 147 (mock) cells pooled from three independent experiments in EGFP and the HD555 channel. Linear regression (line) with 95% confidence intervals. R: Kendall’s tau correlation coefficient. (c) Box plot of HD555 intensities normalized to EGFP are significantly higher for HTL–BCN compared to HTL–TCO* (Wilcoxon rank-sum test, p < 10–23).

