Figure 4.
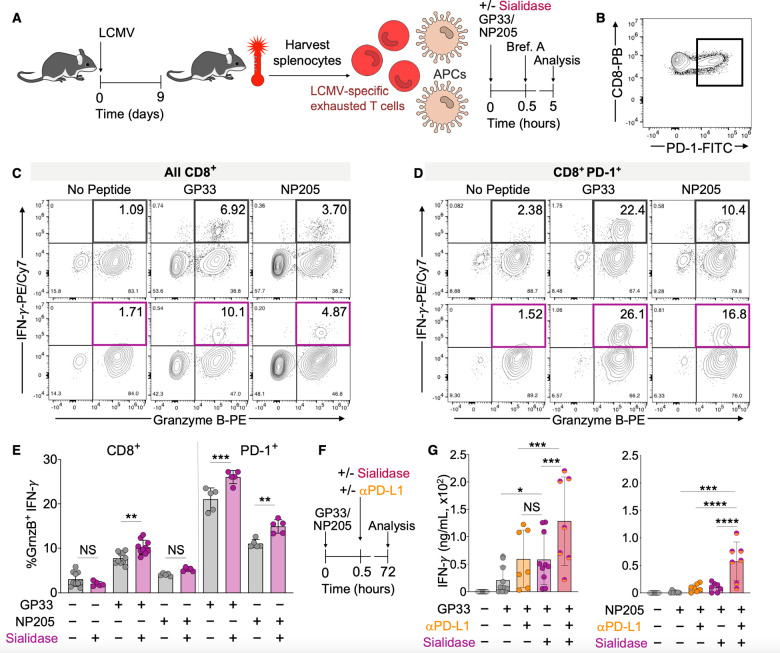
Sialidase enhances revival of hypofunctional T cells. (A) Generation of polyclonal hypofunctional LCMV-specific CD8+ T cells from WT C57BL6/J mice. Animals were infected with LCMV (2 × 10⁶ pfu, clone 13). Spleens were harvested on day 9 postinfection, and splenocytes (containing a mixture of leukocytes including T cells and APCs) were cultured in the presence of GP33 or NP205 LCMV peptide antigens and/or sialidase from V. cholerae (55 mU). Brefeldin A (Brf. A) was added at 0.5 h, and cytokine production in CD8+ T cells was assessed at 5 h via flow cytometry. (B) Representative PD-1 expression on CD8+ T cells from LCMV infected mice. Parent gate: viability dye– CD3+. (C) Representative density maps of activated (GranzymeB+ IFN-γ+) LCMV antigen-specific polyclonal CD8+ T cells. Parent gate: viability dye– CD3+ CD8+. (D) Representative density maps of activated PD-1+ (GranzymeB+ IFN-γ+) LCMV antigen-specific polyclonal CD8+ T cells. Parent gate: viability dye– CD3+ CD8+ PD-1+. (E) Quantification of the percentage of activated CD8+ T cells from C and D (n ≥ 5). (F) Assay workflow for longer term (72 h) activation of T cells made hypofunctional via chronic LCMV infection as in A. (G) Quantification of antigen-induced IFN-γ production by polyclonal CD8+ T cells from LCMV infected mice as in A and F. IFN-γ was quantified via ELISA after 72 h ex vivo stimulation with antigen and anti-mouse PD-L1 (25 μg/mL) and/or sialidase from V. cholerae (55 mU) (n ≥ 4). Mean ± SD (E, G). *P < 0.05, **P ≤ 0.01, ***P ≤ 0.001, ****P ≤ 0.0001, NS = not significant (E, G). One-way ANOVA followed by Tukey’s multiple comparisons test as a paired analysis (E, G).

