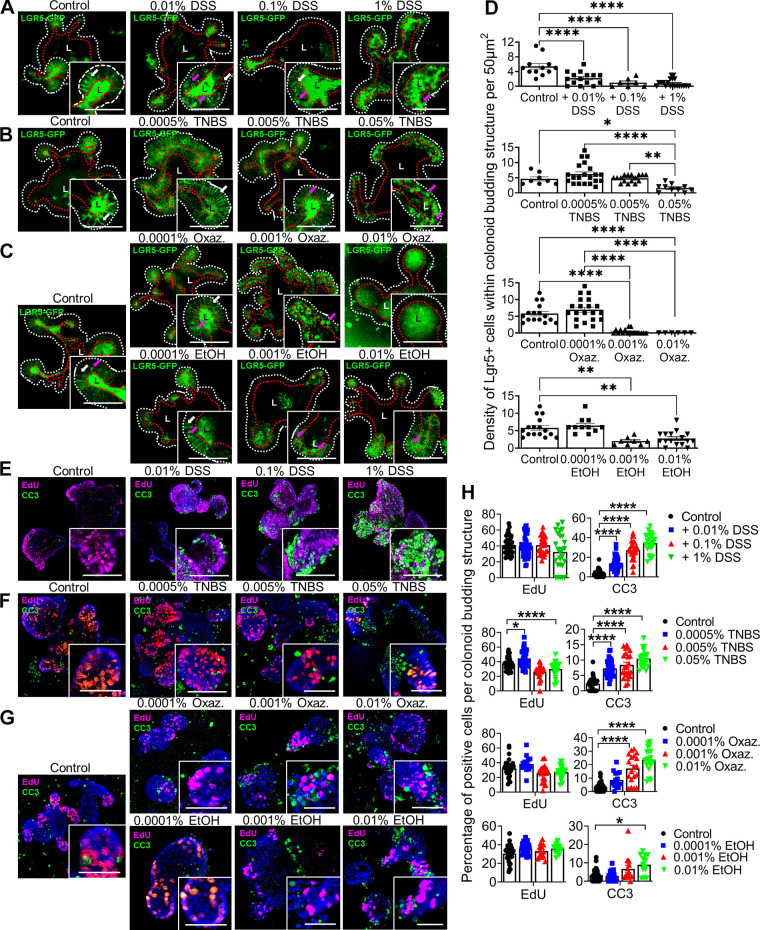
Figure 6.
Agents of chemical colitis directly induce apoptosis of colonic epithelium. Epithelial organoids isolated from the distal colon of Lgr5::DTR-EGFP (Lgr5-GFP) mixed-sex mice were grown and passaged for >5 rounds. Organoids were exposed to chemical colitis agents at different concentrations for 3–5 h, fixed, stained, and imaged on a confocal microscope. The results shown are aggregated from three independent experiments, each of which involved the analysis of >30 organoids per group. The presence of Lgr5+ stem cells within the crypt-like buds of the organoids was assessed by imaging the GFP label, as shown in photomicrographs (A–C). Living cells uniformly express GFP on the cell membrane; in contrast, dying or dead cells exhibit blebs of signal. The basolateral layer of epithelium is highlighted by the dashed white line. The apical layer adjacent to the lumen (“L”) is highlighted by the dashed red line. White arrows within zoomed insets indicate examples of visually normal Lgr5+ cells; magenta arrows indicate examples of blebs. Exposure to low doses of dextran sulfate sodium (DSS) induced blebbing in Lgr5+ cells (A). Exposure to TNBS (B) or oxazolone (C) induced abnormalities in Lgr5+ cells only at higher doses. Some of these effects were attributable to the ethanol (EtOH) solvent (C) for the haptenating agents. Quantification (D) of the density of visually normal Lgr5+ cells confirms the dose-dependent loss of cells with DSS exposure and loss at higher doses of TNBS, oxazolone, or ethanol. E–H: organoids were exposed to 10 µM 5-ethynyl-2′-deoxyuridine (EdU) for 30 min before fixation. Fixed organoids were stained for the EdU incorporation (proliferation, magenta) and cleaved caspase 3 (apoptosis, green). The blue signal represents Hoechst staining (cellular nuclei). Shown are images associated with exposure to DSS (E), TNBS (F), oxazolone (G), or EtOH (G), as well as the quantification (H) of the density of positively stained cells per organoid bud. The results support only very minor proliferative changes associated with treatments. However, the all agents increased the number of apoptotic cells at low (DSS) or higher (TNBS, oxazolone, EtOH) doses. Scale bars: 50 µm. Statistics: *P < 0.05; **P < 0.01; ***P < 0.001; ****P < 0.0001. One-way ANOVA, Tukey’s post hoc test. Error bars: means ± SE.

