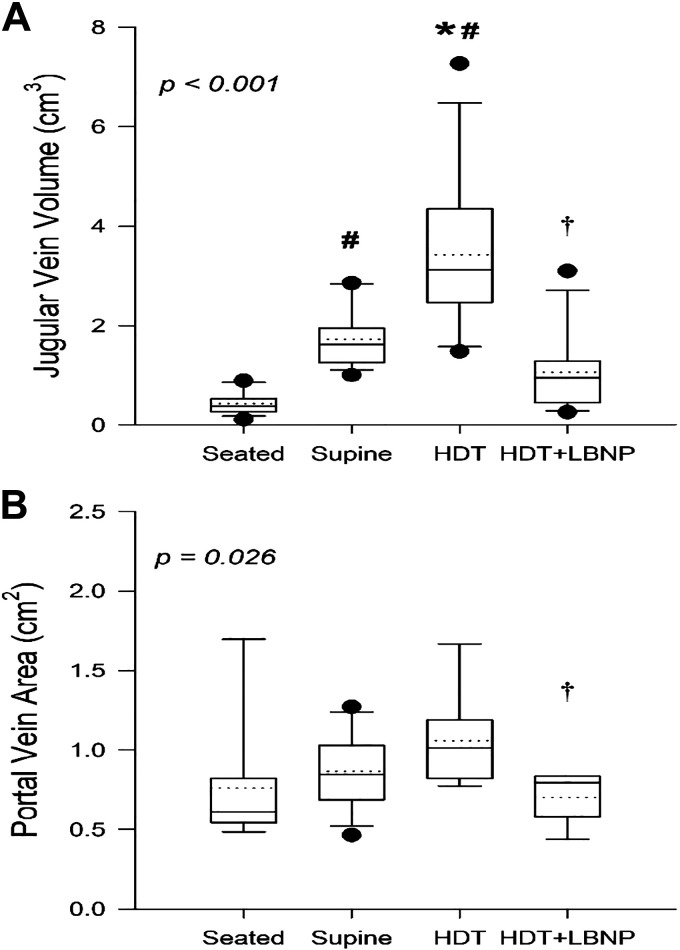
Figure 1.
Boxes show values of jugular vein volume (A) and portal vein cross-sectional area (B) with preflight seated rest (seated), supine rest (supine), 15° head-down tilt (HDT), and lower body negative pressure (LBNP) applied at −25 mmHg during HDT (HDT + LBNP). Box boundaries represent the 25th and 75th percentiles, with whiskers representing the 10th and 90th percentiles. Median and mean values are shown as solid and dotted lines within the boxes, respectively, with dots indicating outlying points. A linear mixed-effects model was used and found a main effect of measurement time point for jugular vein volume (P < 0.001) and portal vein area (P = 0.026). Tukey’s post hoc analysis results are indicated by the symbols as follows: *different from supine (P < 0.05); #different from seated (P < 0.05); and †HDT + LBNP different from HDT (P < 0.05). The sample number and sex breakdown of each time point are as follows: jugular vein volume in seated, n = 14, 3 females; supine, n = 14, 3 females; HDT, n = 12, 2 females; HDT + LBNP, n = 12, 3 females; portal vein area in seated, n = 8, 2 females; supine, n = 14, 3 females; HDT, n = 8, 3 females; HDT + LBNP, n = 7, 3 females.

