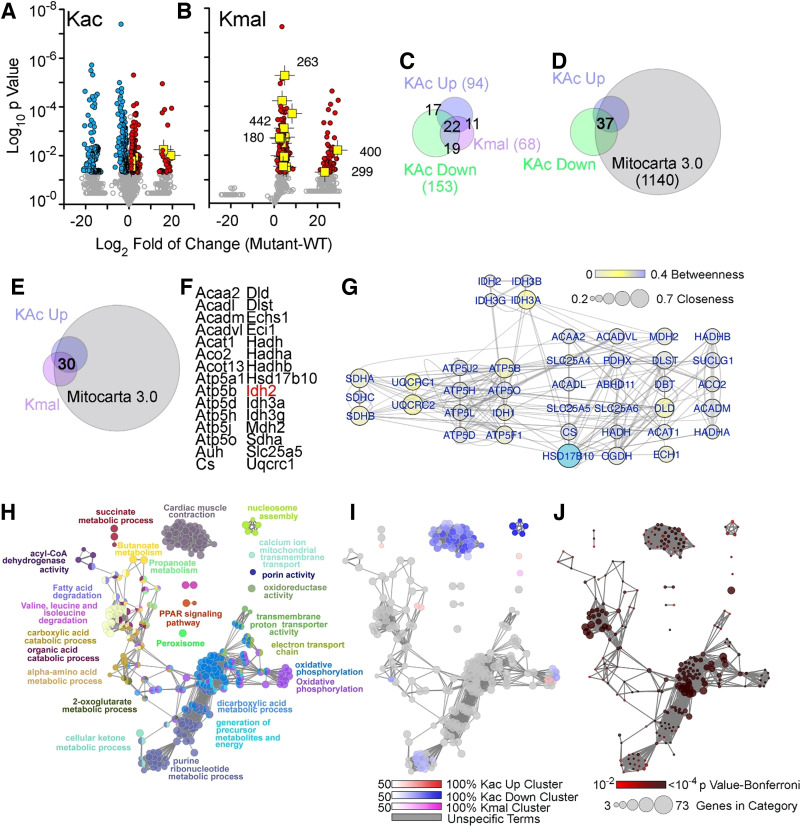
Figure 3.
SLC25A3 deletion-induced acylome remodeling preferentially targets mitochondrial ontologies. A and B: volcano plots of acetylated proteins (Kac) and malonylated proteins (Kmal). Colored symbols depict peptide hits with a twofold increase (red symbols) or decrease (blue symbols). n = 5 fl/fl and n = 5 fl/flxMCM animals were used for acetylation MS studies, and n = 5 fl/fl and n = 4 fl/flxMCM animals were used for malonylation MS studies. Student’s t tests were used for statistical analyses with a P value < 0.05 considered significant. Isocitrate dehydrogenase 2 (IDH2)-acylated peptides are depicted in yellow with the lysine modified numbered in B. Note that the segregation of values into populations along the x-axis of the volcano plots is due to zero intensity in some of the proteins quantified (see Supplemental Tables S1 and S2 as well as Supplemental Fig. S2 for detailed information). C–E: Venn diagrams identifying different categories of acylation and their intersection with the curated Mitocarta 3.0 dataset. F: list of proteins that exhibited increases in both acylation and malonylation. G: interactome of the proteins listed in G. Node connectivity was quantified by betweenness and closeness centrality indexes using Cytoscape. H–J: ClueGo analysis of the three categories of acylome modifications: increased acetylation, decreased acetylation, and increased malonylation. The GO Biological process and KEGG databases were queried with a threshold Bonferroni-corrected P value below 0.01. H: all proteins in the three categories analyzed simultaneously. I: the percent contribution of each of the three acylation categories to the ontology term presented in H. J: P value and number of genes per ontology term presented in H.

