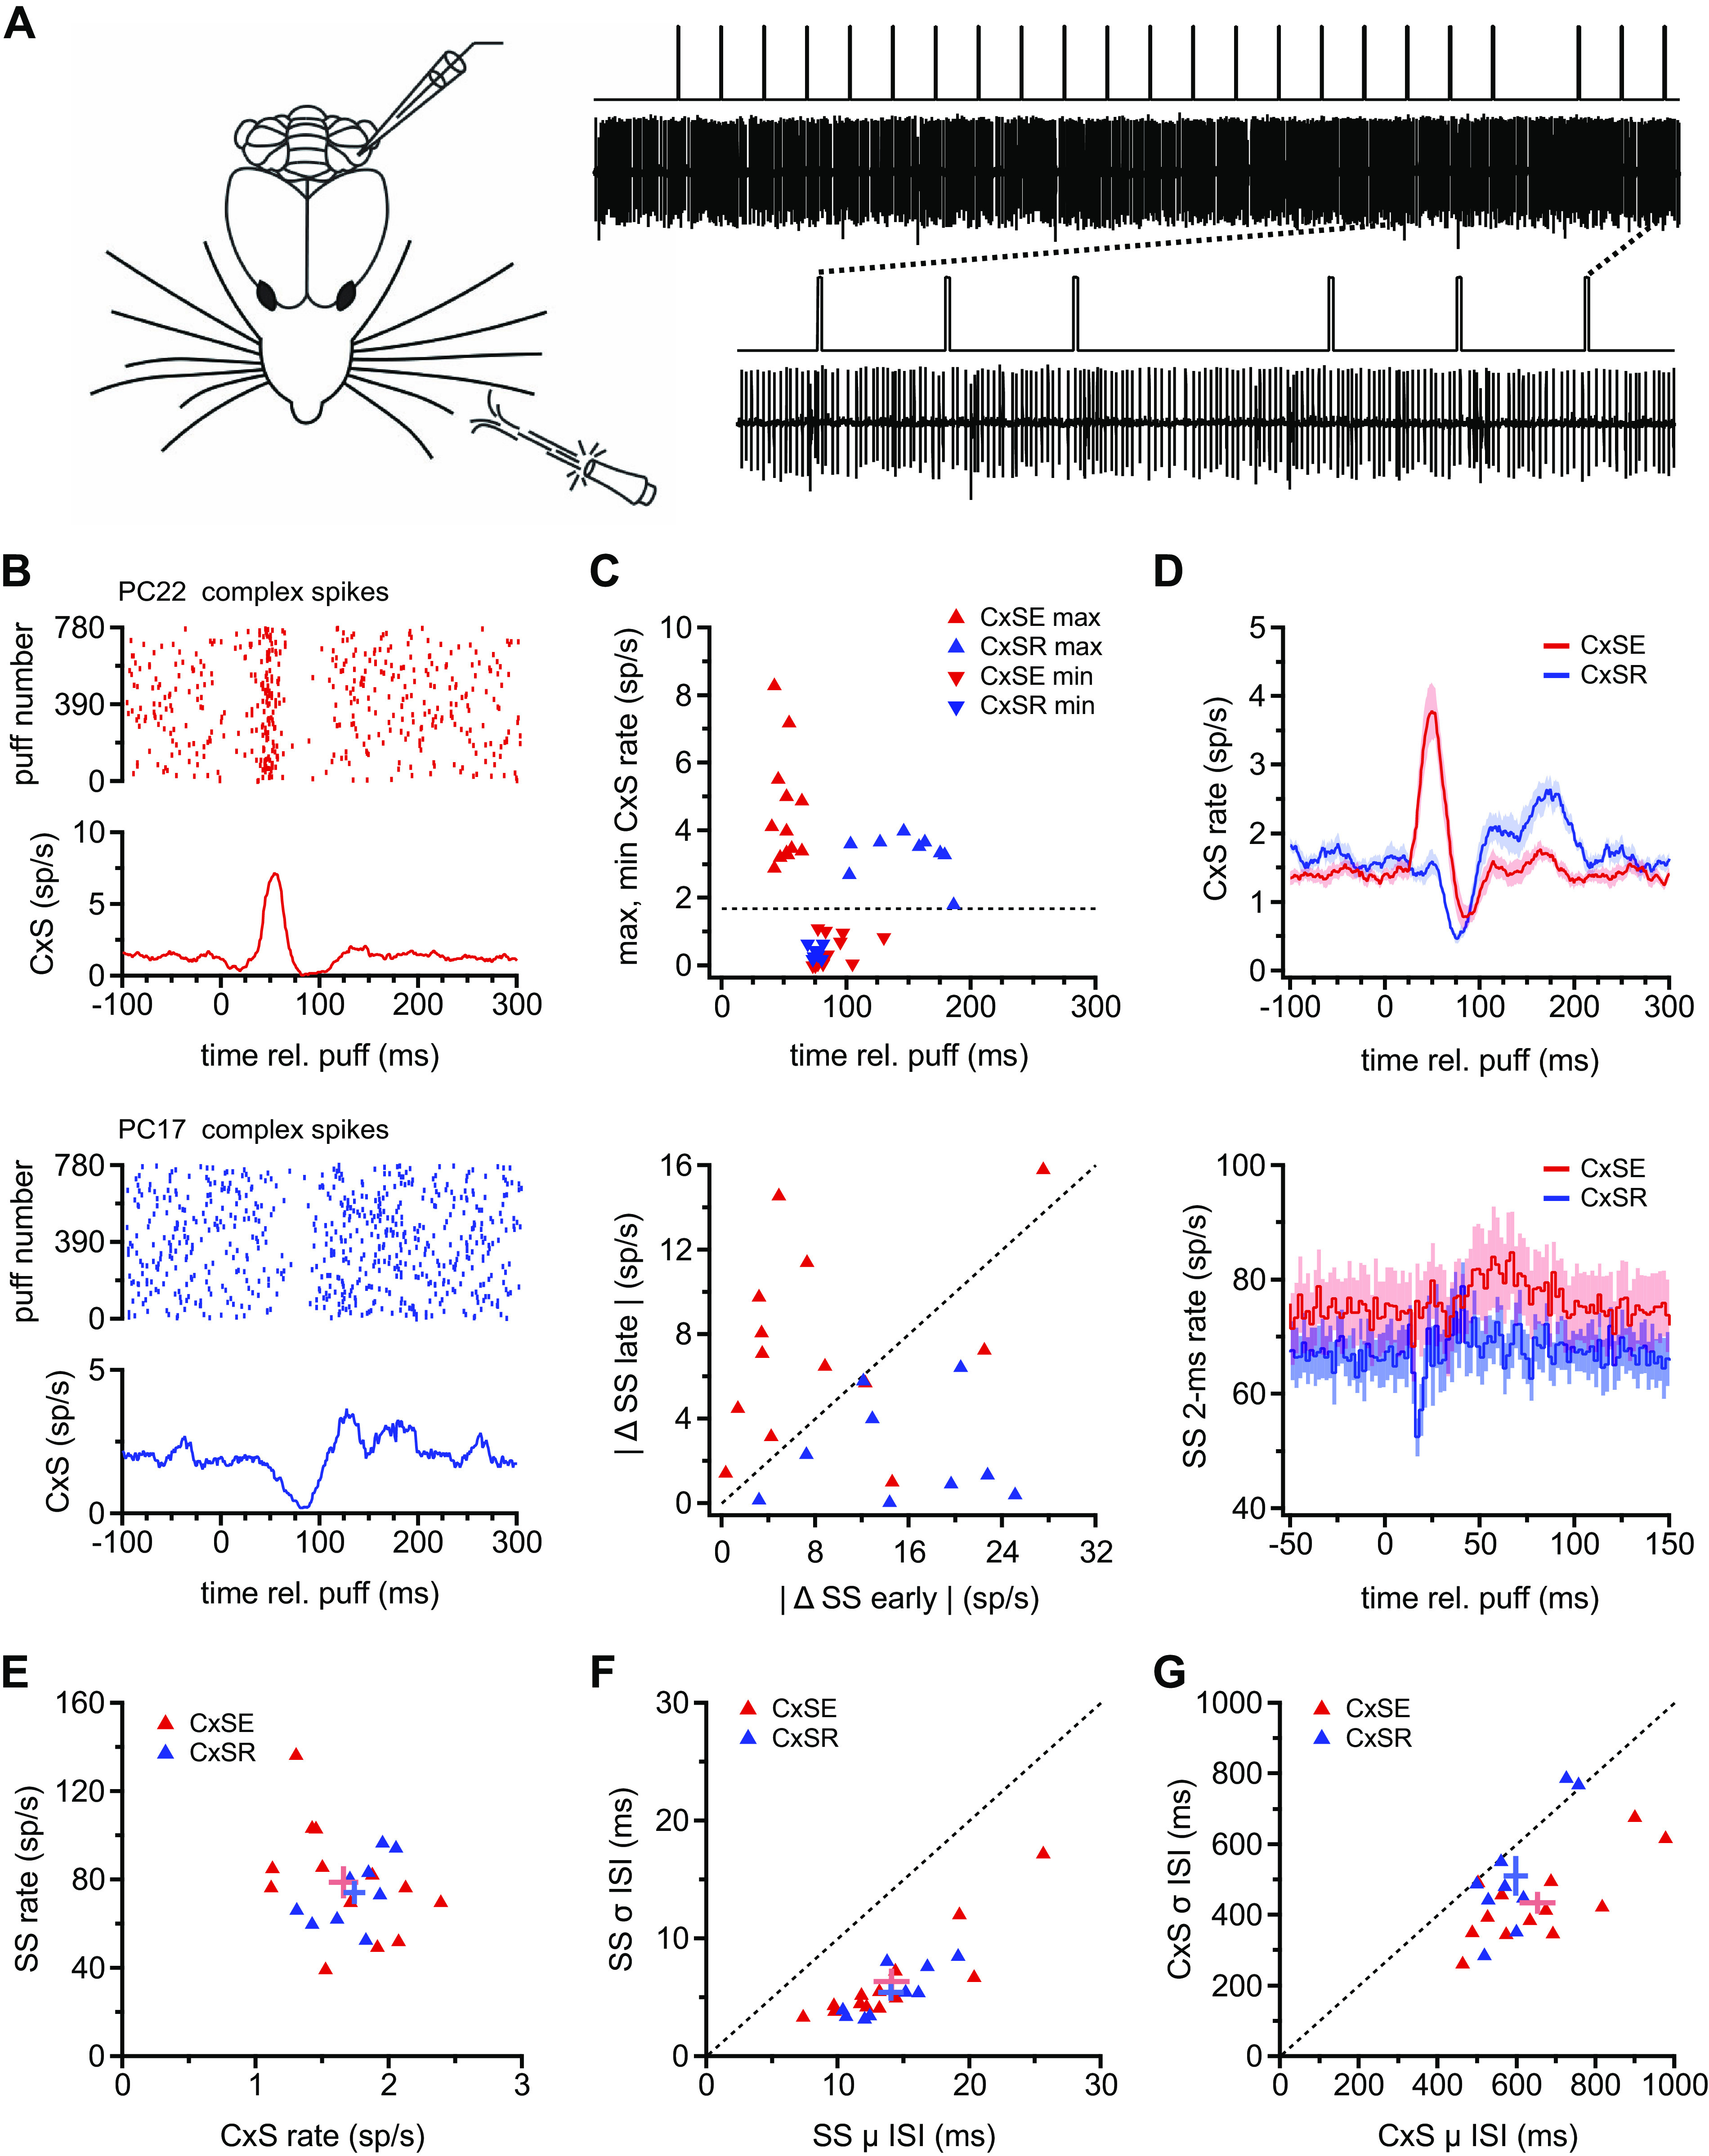
Figure 1.

Two types of Purkinje cell responses to repetitive whisker stimulation with air puffs. A, left: schematic of air puff stimulation applied to the ipsilateral whisker pad during Purkinje cell recordings from awake mice. Right: illustration of a sample recording and the stimulus protocol. The stimulus was composed of trains of air puffs with a 300-ms interstimulus interval and an omission every 18–22 stimuli. Dotted lines indicate the region of the record at top that is expanded at bottom. B: sample rasters of complex spikes (CxSs) showing either well-timed spikes (top) or a gap in spikes consistently following air puffs (bottom). C, top: maximum (▴) and minimum (▾) complex spike firing rates from the mean rate traces calculated as in B for each Purkinje cell. Data from cells classed as complex spike elevated (CxSE) and complex spike reduced (CxSR) are red and blue, respectively. Dotted line indicates the mean prestimulus CxS rate across all cells. Bottom: absolute values of the mean change in simple spike (SS) rate between 50 and 74 ms (“late”) vs. the minimum change in SS rate between 14 and 18 ms (“early”) for each Purkinje cell. Data from cells classed as CxSE and CxSR are red and blue, respectively. D, top: traces of mean CxS firing rate for all 780 puffs averaged across all 13 CxSE cells (n = 13, red) and all CxSR cells (n = 9, blue). Bottom: population peristimulus time histograms (2-ms bins) of simple spikes, averaged for all 780 puffs for all CxSE cells (red) and all CxSR cells (blue). E: prestimulus SS rate vs. CxS rate for all cells (symbols). Mean and SE for each group are indicated with the crossed error bars. F: prestimulus SD (σ) on the interspike interval (ISI) vs. mean (μ) SS ISI for all cells. Mean and SE as in E. G: as in F for CxS. rel., Relative to.
