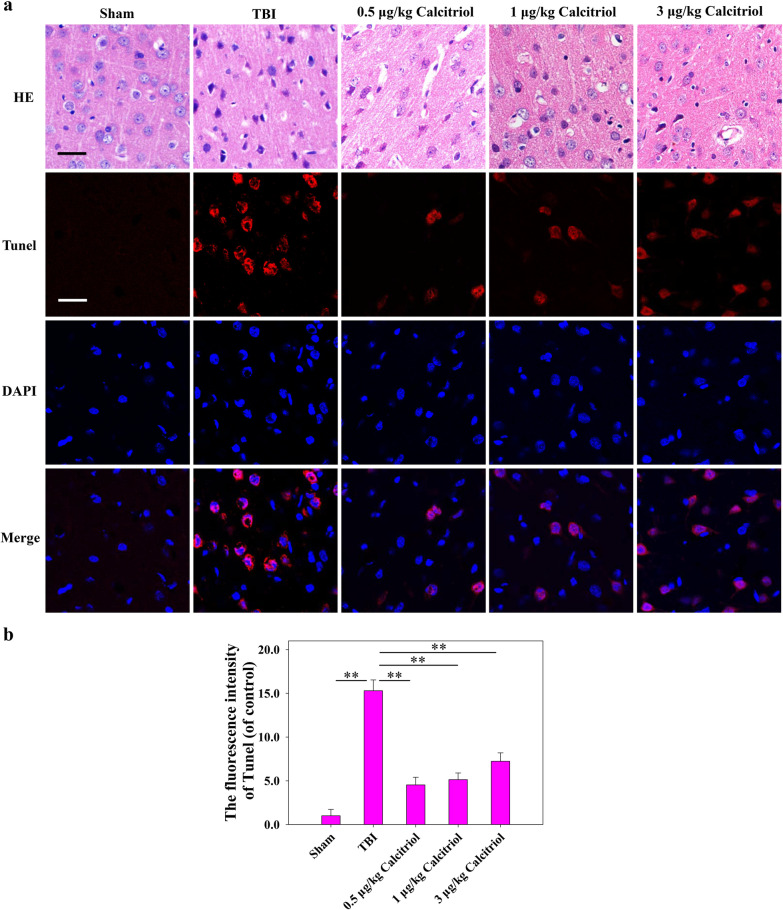
Fig. 2.
Calcitriol treatment mitigated TBI-induced histopathological changes. a Representative images of the histological assessment of the frontal cortex via hematoxylin and eosin (H&E) and TUNEL staining (Bar = 50 µm). b Statistical graphs of apoptosis cells (% of DAPI). Data are presented as means ± SEM (n = 5). **P < 0.01 versus the indicated groups. (Sham: sham-operated group; TBI: TBI model group; Calcitriol: TBI + calcitriol treatment group)

