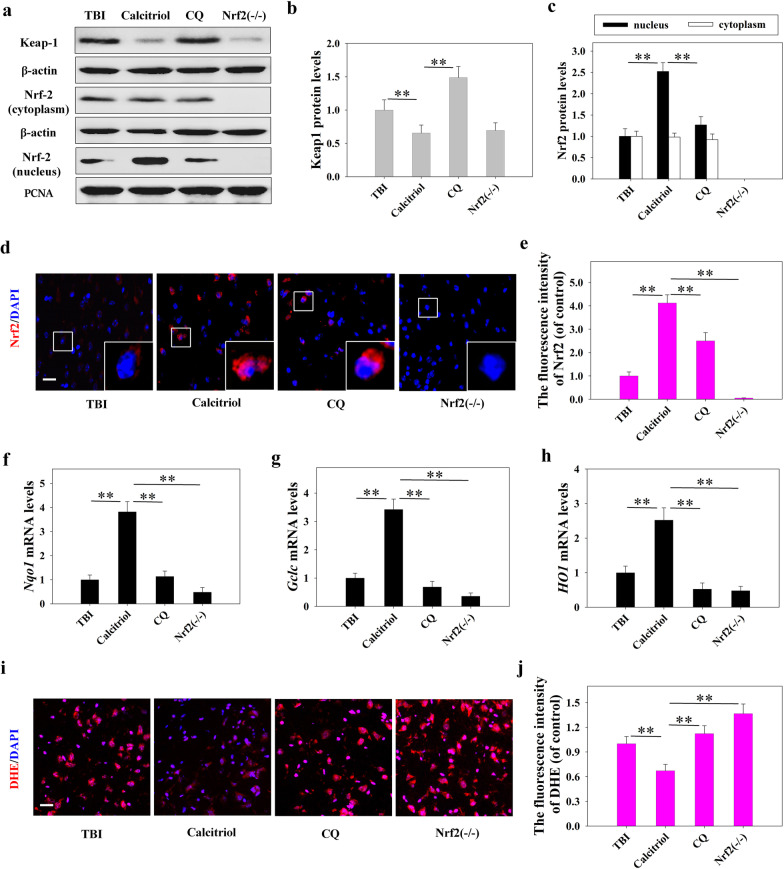
Fig. 6.
Inhibiting autophagy abolished calcitriol (0.5 µg/kg)-induced Nrf2 activation following TBI in mice. a Representative images of Western blot staining for Keap1, cytoplasmic Nrf2, and nuclear Nrf2. b Statistical graphs of Keap1 protein expression. c Statistical graphs of expression of Nrf2 in the nucleus and cytoplasm. d, e Representative immunofluorescence images and statistical graphs of Nrf2 translocation (Bar = 50 µm). f The relative mRNA expression level of Nqo1. g The relative mRNA expression level of Gclc. h The relative mRNA expression level of HO1. i, j Representative images and statistical graphs of immunofluorescence assays of dihydroethidium (DHE) (Bar = 50 µm). Data are presented as means ± SEM (n = 5). *P < 0.05 and **P < 0.01 versus the indicated groups. (TBI: TBI model group; Calcitriol: TBI + calcitriol treatment group; CQ: TBI + calcitriol + CQ treatment group; Nrf2−/−: TBI + calcitriol + Nrf2 knockout group)

