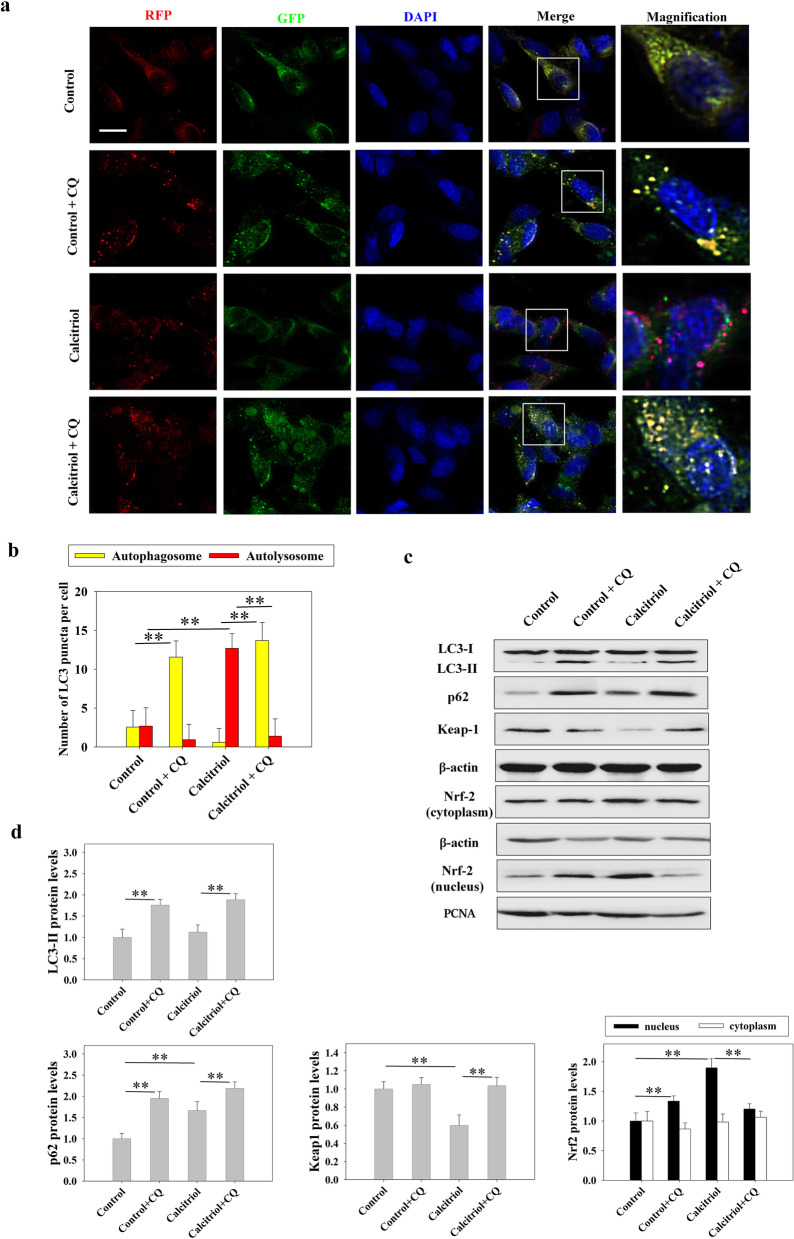
Fig. 8.
Effect of calcitriol (10 nM) on autophagy and Keap1-Nrf2 pathway in neuronal cells. a Representative immunofluorescence images of autophagy flux detected by a tandem RFP-GFP-LC3 reporter (Bar = 20 µm). b Statistical graphs of number of autophagosomes and autolysosomes per cell. c Representative images of Western blot staining for LC3, p62, Keap1, cytoplasmic Nrf2, and nuclear Nrf2. d Statistical graphs of LC3-II, p62, Keap1 and Nrf2 (cytoplasmic and nuclear) protein expression levels. Data are presented as means ± SEM (n = 5). *P < 0.05 and **P < 0.01 versus the indicated groups

