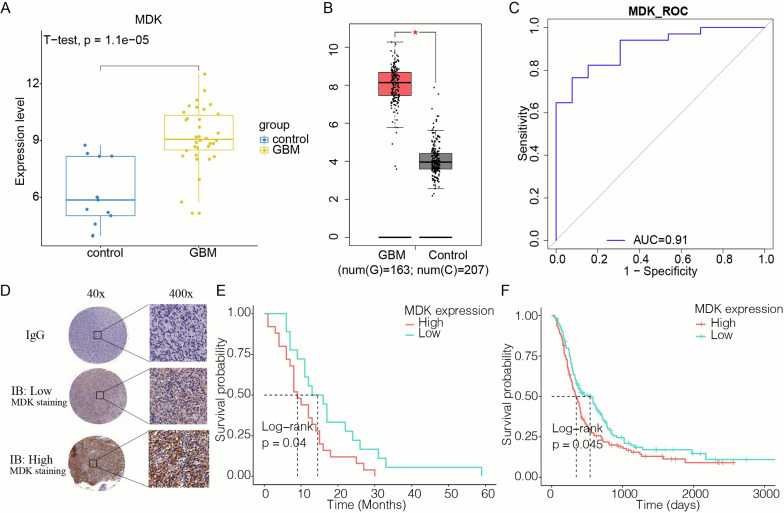
Fig. 1.
Expression of MDK in GBM as a diagnostic and prognostic biomarker. A The expression of MDK in healthy brain is lower than in GBM samples in GSE50161. B The expression of MDK in normal control samples (n = 207) is lower than in GBM samples (n = 163) in the TCGA and GTEx datasets. * p < 0.05. C The receiver operating characteristic (ROC) curve of MDK as a biomarker of GBM in GSE50161. D Representative images of immunohistochemical staining in tumor sections of patients with GBM. MDK showed high and low expression in GBM tissues from different patients. Immunoglobulin (IgG) was used as a negative control. E Kaplan–Meier curves of overall survival for 43 GBM patients, divided by MDK expression. F Kaplan–Meier curves of overall survival for GBM patients in the CGGA database, stratified by MDK expression. MDK: midkine; GBM: glioblastoma; TCGA: The Cancer Genome Atlas; GTEx: Genotype‑Tissue Expression; CGGA: Chinese Glioma Genome Atlas; IB: Immunoblotting

