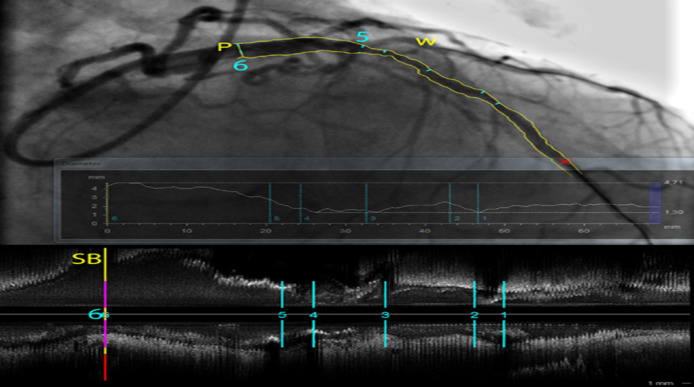
Figure 1.
Quantitative coronary analysis analysis (CAAS software, Pie Medical Imaging) of a long stenosis in a left anterior descending artery. The vessel borders are automatically detected and diameters are plotted along the vessel centerline. Different measurements (1-6) are shown on a co-registered intravascular ultrasound (IVUS) pull-back longitudinal view at the bottom. At P (6), the ostium free of disease of a large side branch (first diagonal artery) is better characterized in the 3D volume data from the IVUS pull-back than on the overlapping structures of the angiogram. (W) shows a wire in the second diagonal branch, illustrating the inherent limitations in the interpretation of a coronary angiography that is only a 2D shadow projection of a complex 3D coronary tree filled with contrast that requires multiple views in different projections.

