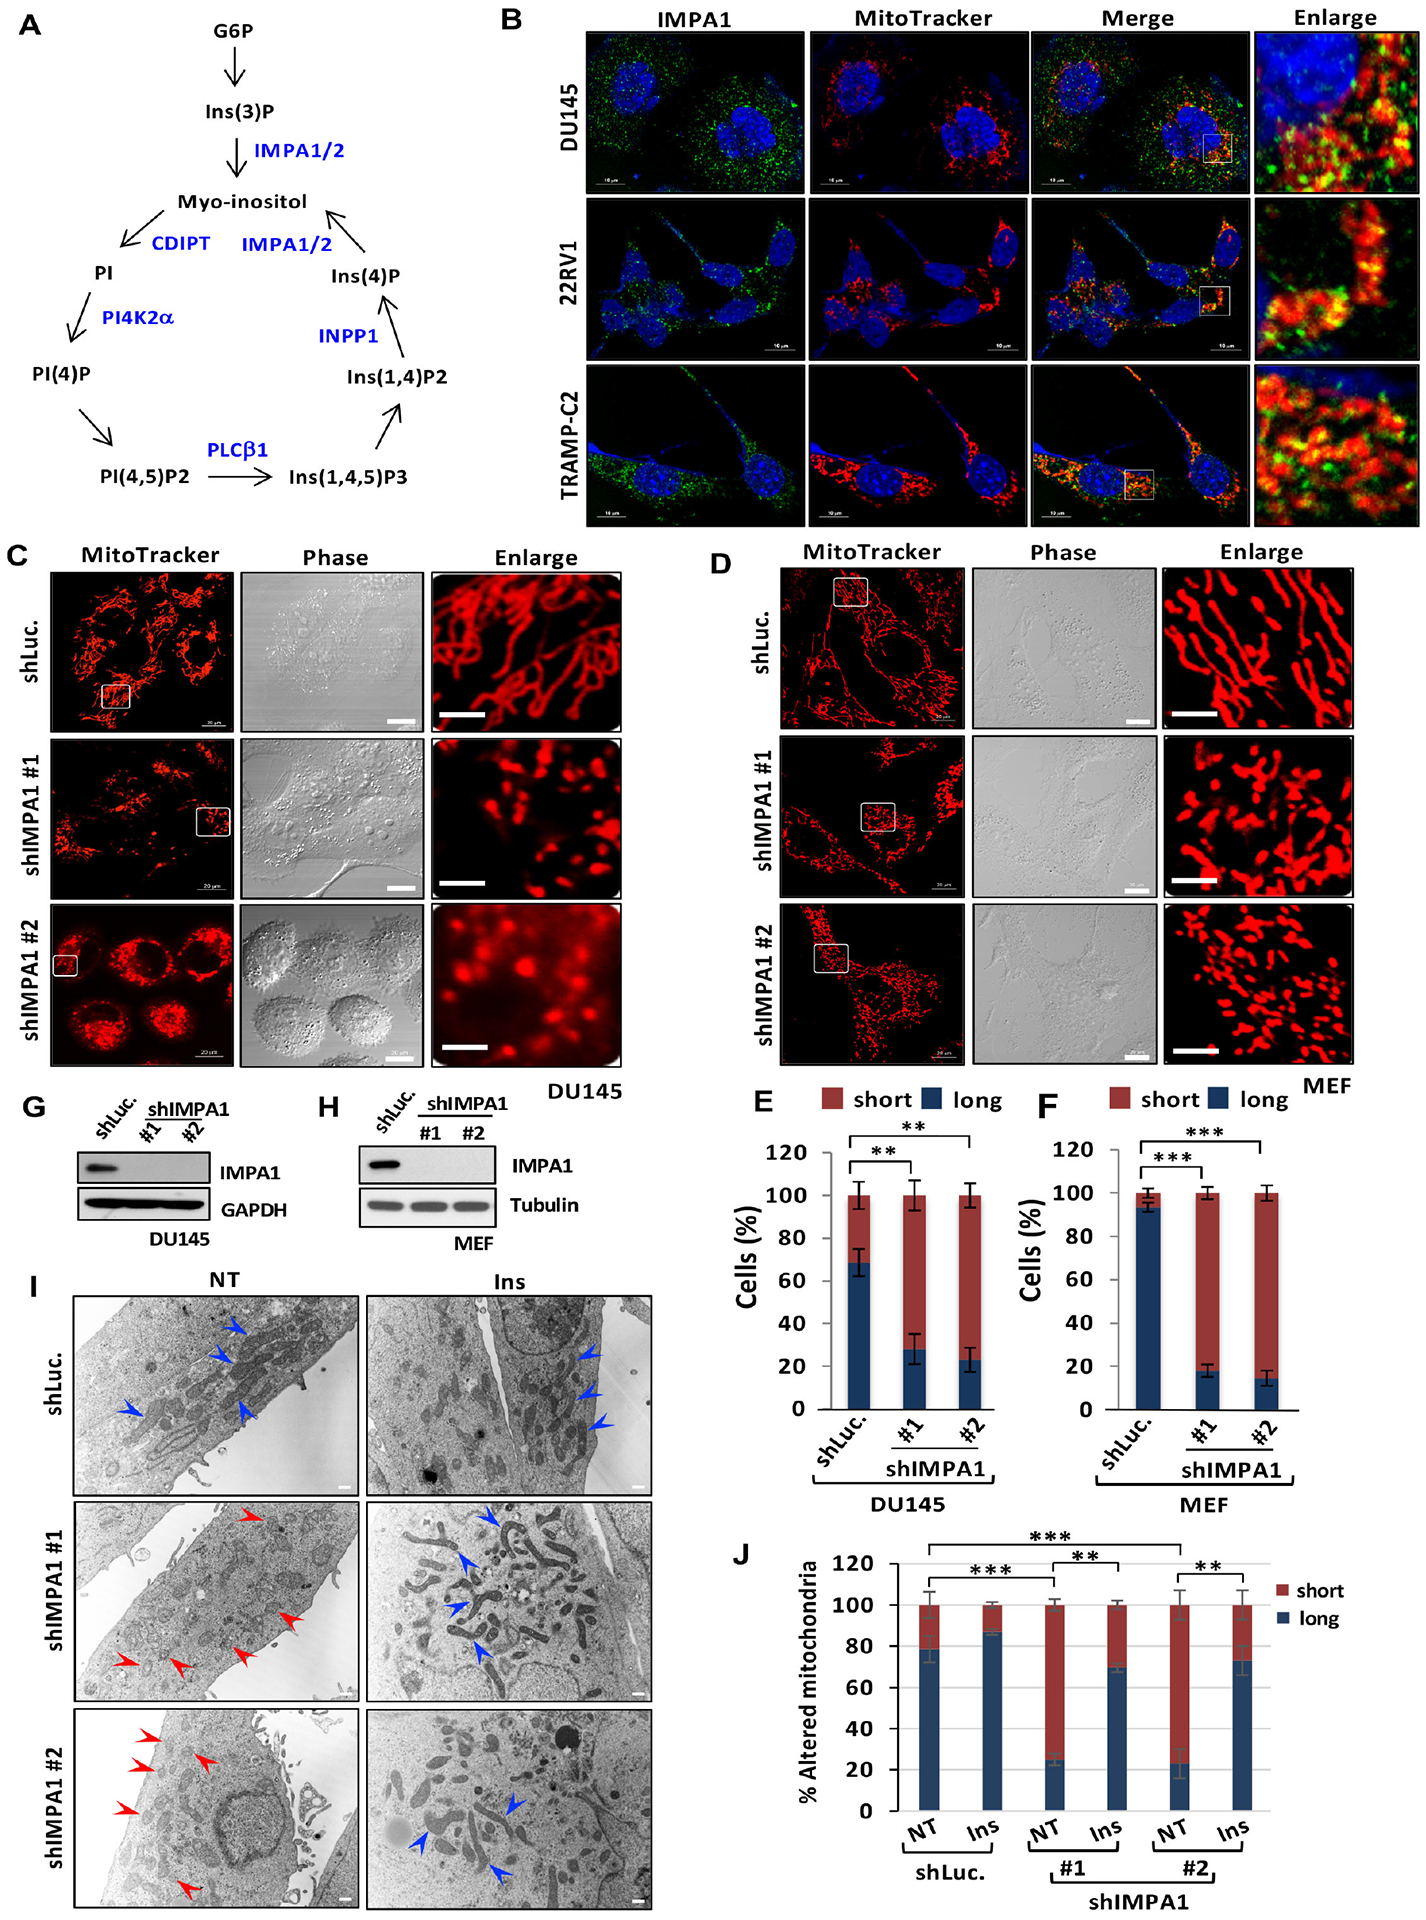
Figure 1. IMPA/Inositol regulates mitochondrial fission.

(A) Phosphoinositides metabolism with a series of enzymes. (B) Subcellular localization of IMPA1 using IMPA1 antibody (Green), MitoTracker (red) and DAPI (blue) in diverse cancer cell lines. (C and D) Mitochondrial morphology by MitoTracker (red) in shLuc. or shIMPA1 DU145 cells (C) or MEFs (D). Scale bar, 20 μm in MitoTracker and Phase; 5 μm in Enlarge. (E and F) Quantification of the mitochondrial morphology of the DU145 cells (C) and MEFs (D) shown in (E) and (F). (G and H) The shLuc. or shIMPA1 DU145 or MEFs were subjected to immunoblotting. (I) TEM was performed in shLuc. or shIMPA1 DU145 cells of upon vehicle (NT) or inositol treatment (Ins). Scale bar, 500 nm. Blue arrow, healthy/elongated mitochondria; Red arrows, fragmented mitochondria. (J) Quantification of the mitochondrial morphology (long and short) shown in (I).
