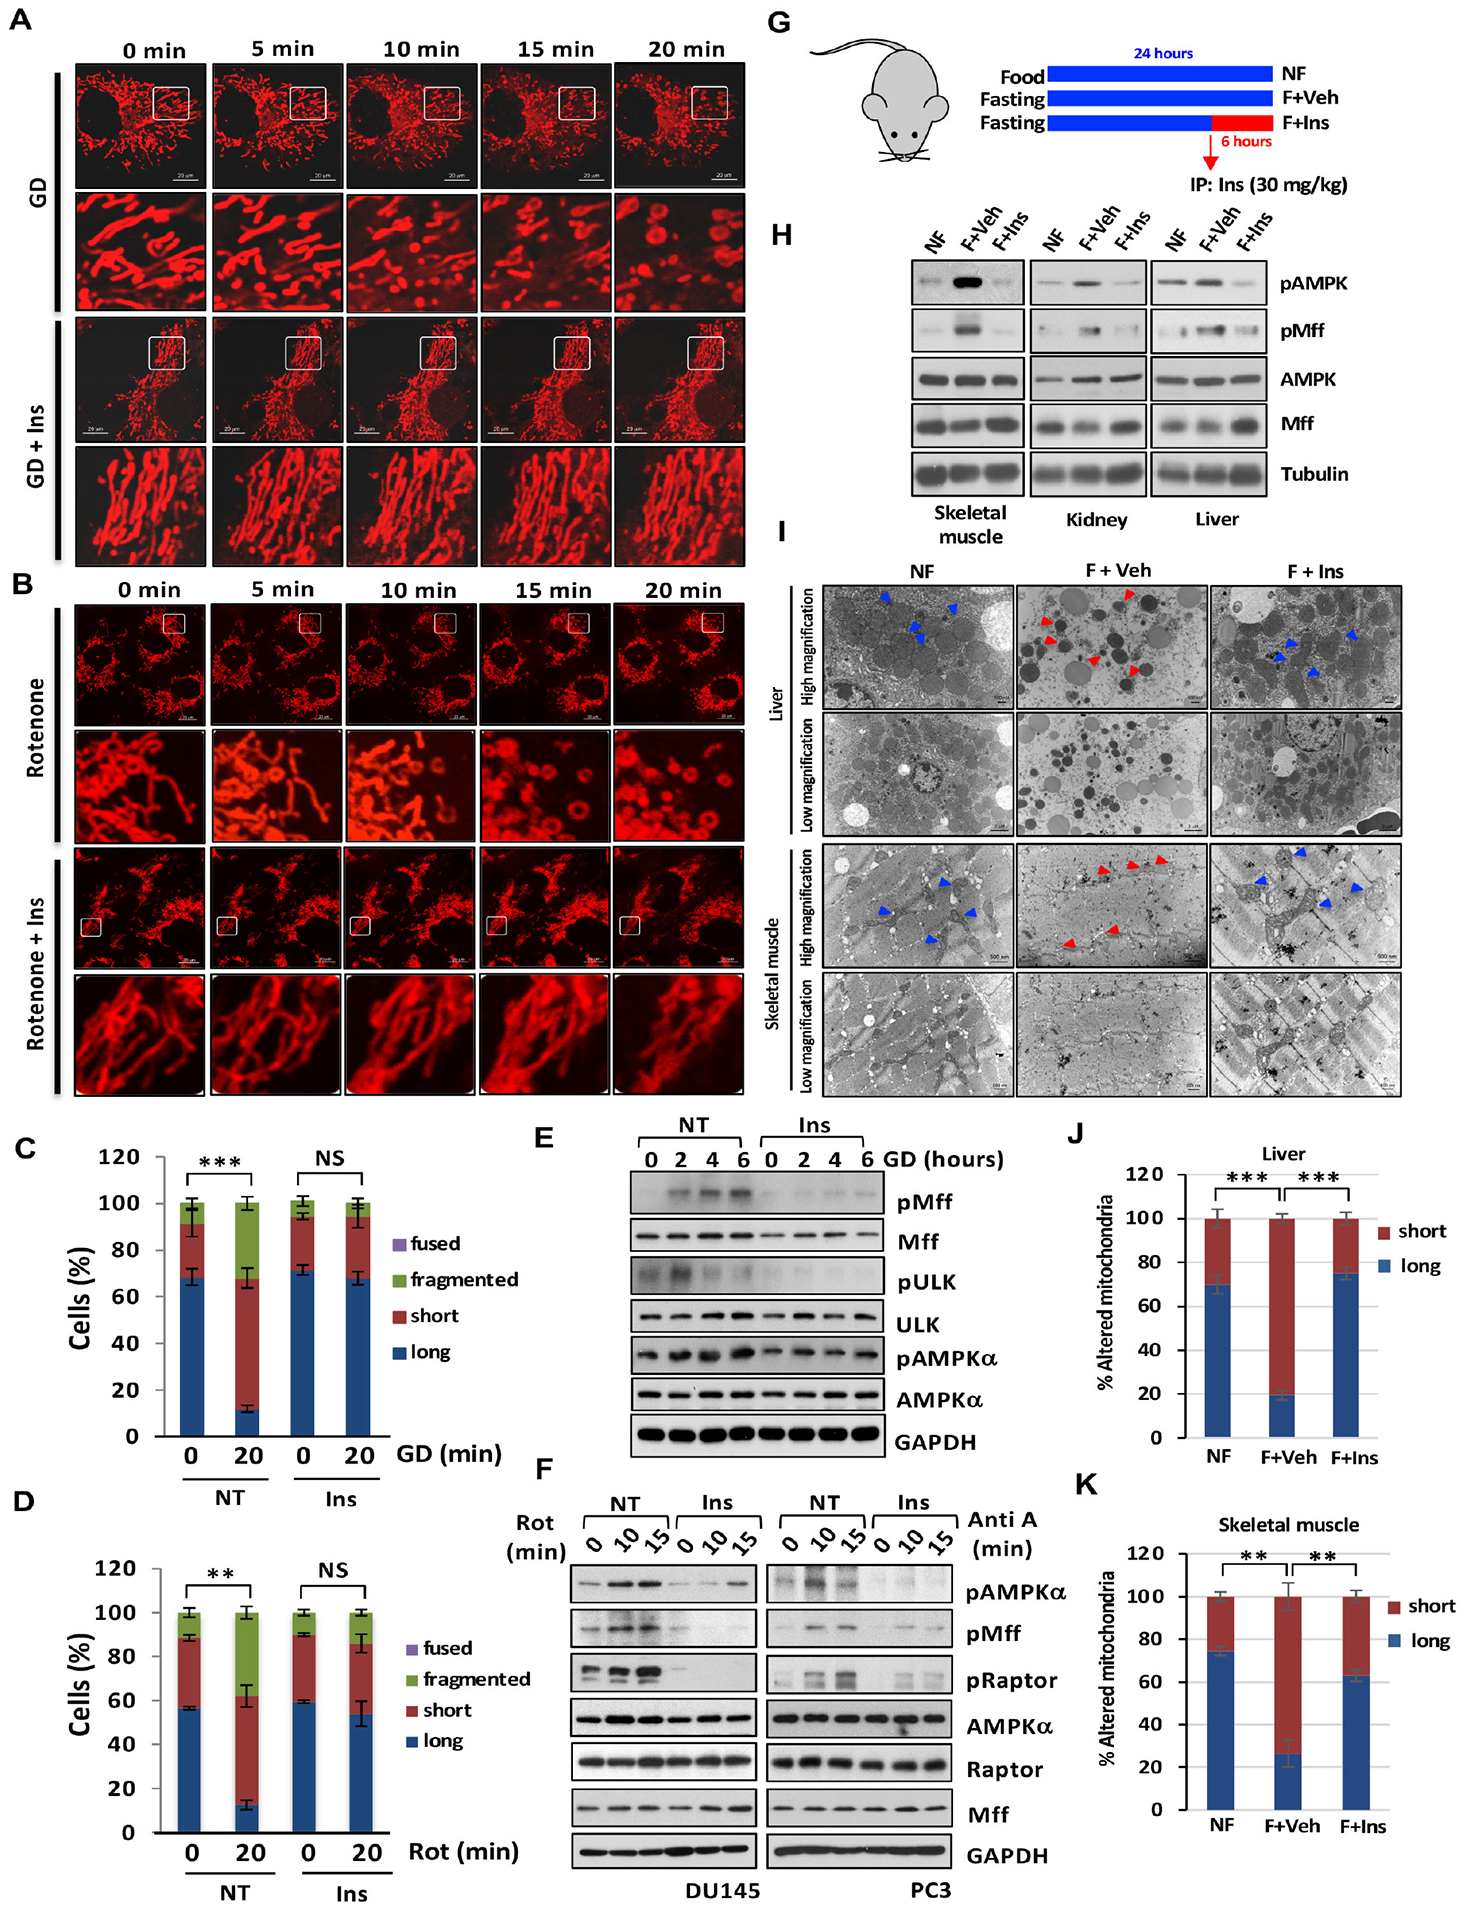
Figure 5. Inositol decline leads to AMPK activation and mitochondrial fission under diverse stresses.

(A) Time-lapse images of DU145 cells stained with MitoTracker upon glucose deprivation (GD) or GD with Ins treatment for various time points. Scale bar, 20 μm. (B) Time-lapse images of DU145 cells stained with MitoTracker upon indicated treatments. Scale bar, 20 μm. (C) Quantification of the mitochondrial morphology of the cells shown in (A) at 20 min upon indicated treatment. (D) Quantification of the mitochondrial morphology of the cells shown in (B) at 20 min upon rotenone (Rot) with or without Ins treatment. (E) Immunoblotting of DU145 cells upon indicated treatments. (F) Immunoblotting of PC3 or DU145 cells upon indicated treatments. (G) The graphic showed mice fasted for 24 hours and Ins treatment by intraperitoneal injection (30 mg/kg) at mice fasted for 18 hours. (H) The protein extract from diverse tissues were subjected to Immunoblotting. (I) Images of TEM upon mice fed with food, no fasting (NF), fasted with vehicle (F+Veh) and fasted with Ins (F+Ins). Scale bar, 500 nm and 2 μm. (J and K) Quantification of the mitochondrial morphology (long and short) shown in (I).
