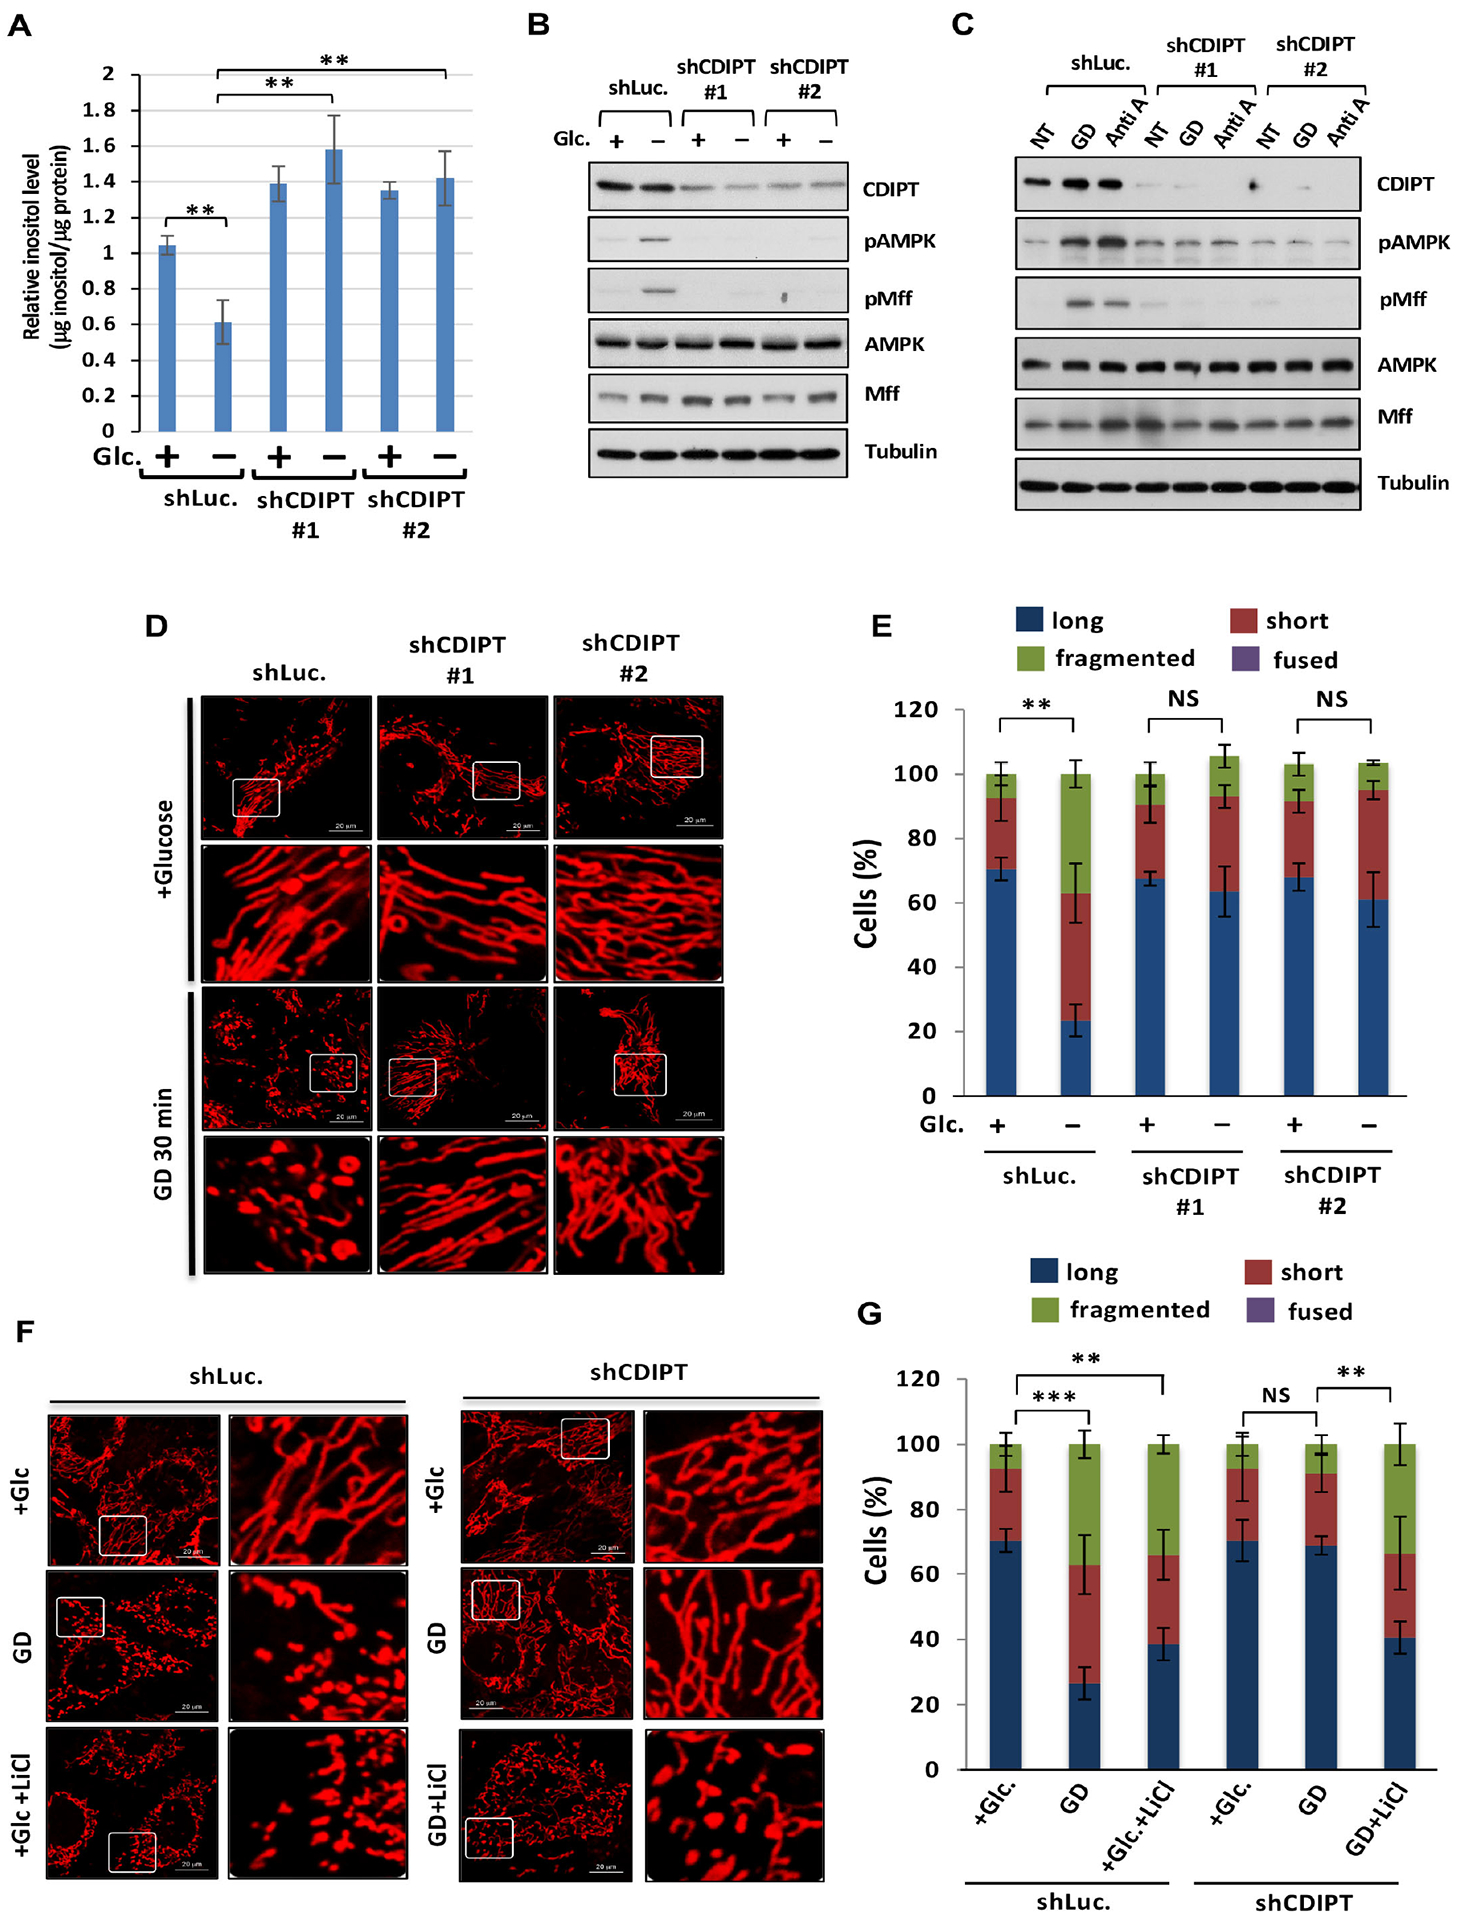
Figure 6. CDIPT loss leading to inositol accumulation prevents mitochondrial fission upon energy stress.

(A) The levels of inositol in shLuc. or shCDIPT DU145 with or without glucose for 30 minutes is determined by K-INOSL assay kit. (B) Immunoblotting of shLuc. or shCDIPT DU145 cells with or without glucose deprivation (GD) for 30 minutes. (C) Immunoblotting of shLuc. or shCDIPT PC3 cells upon vehicle (NT), GD or Anti A. (D) Confocal images of mitochondrial morphology in shLuc. or shCDIPT DU145 cells upon GD for 30 minutes. Scale bar, 20 μm. (E) Quantification of the mitochondrial morphology of the cells shown in (D). (F) Confocal images of mitochondrial morphology in shLuc. or shCDIPT DU145 cells upon GD or lithium chloride treatment for 30 minutes. (G) Quantification of the mitochondrial morphology of the cells shown in (F).
