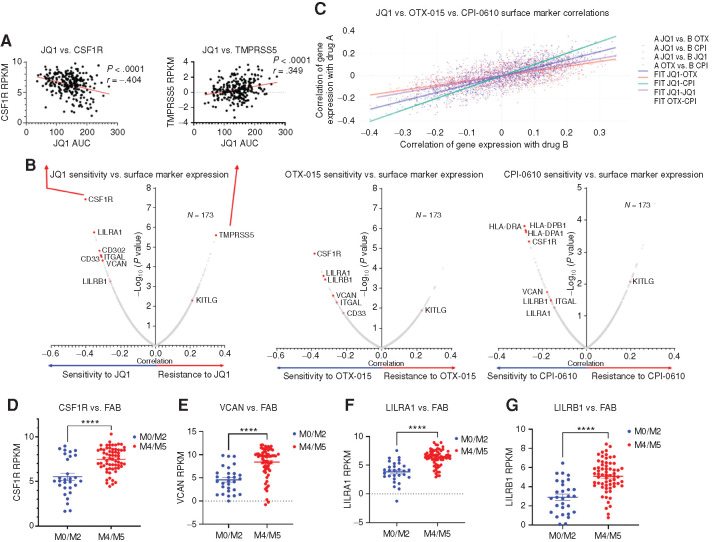
Figure 1.
Identification of correlates of BETi resistance and sensitivity in AML patient samples. A, Correlations between ex vivo sensitivity to JQ1 in 173 patient samples and expression of monocytic differentiation markers with the Beat AML data set. Each dot represents a unique patient sample ex vivo response to a BETi [area under the curve (AUC), determined by MTS viability assay] plotted against mRNA level of the surface marker denoted (CSF1R, TMPRSS5). A simple linear regression model was fit separately for each inhibitor and gene, with the inhibitor AUC values as the outcome. The t-statistic and P value test whether the slope is nonzero and corrected for multiple comparisons. Corresponding correlation coefficients were computed using the relationship to the linear model: slope*(sd(expr)/sd(auc)), where sd indicates standard deviation. RPKM, reads per kilobase per million mapped. B, Pearson correlation coefficients and significance, corrected for multiple comparisons, are calculated for each surface marker mRNA expression and ex vivo sensitivity to a BETi in 173 Beat AML patient sample data set. Each dot represents a correlation coefficient and corresponding P value for individual surface marker mRNA versus BETi AUC (as shown in A, extended to all known surface markers). Points of interest are highlighted in red. C, Pearson correlations for sensitivity to each individual BETi (JQ1, OTX-015, and CPI-0610) versus surface marker expression calculated previously in B, plotted against each other with a line of best fit highlighting their congruence. Each point thus represents the XY coordinate location of correlations for a surface marker between two different BETi, for example, a single point will be X = JQ1 versus CSF1R correlation, Y = OTX-015 versus CSF1R correlation, or X = OTX-015 versus ITGAL correlation versus Y = CPI-0610 versus ITGAL correlation. Dark purple dots represent comparisons between JQ1 and OTX-015, orange represents comparisons between JQ1 and CPI-0610, green represents comparisons between JQ1 against itself, and light purple represents comparisons between OTX-015 and CPI-0610. Corresponding lines of best fit match the above comparisons. D–G, Comparison of RNA expression levels (RPKM) of CSF1R (D), VCAN (E), LILRA1 (F), and LILRB1(G) across FAB groups M0 to M2 (29 samples), undifferentiated AML, and M4 and M5 (34 samples), myelomonocytic–monocytic AML (83) within the Beat AML patient data set (3). P values determined by Mann–Whitney t tests. The x-axis denotes FAB subtype; the y-axis denotes RPKM expression of a given gene.

