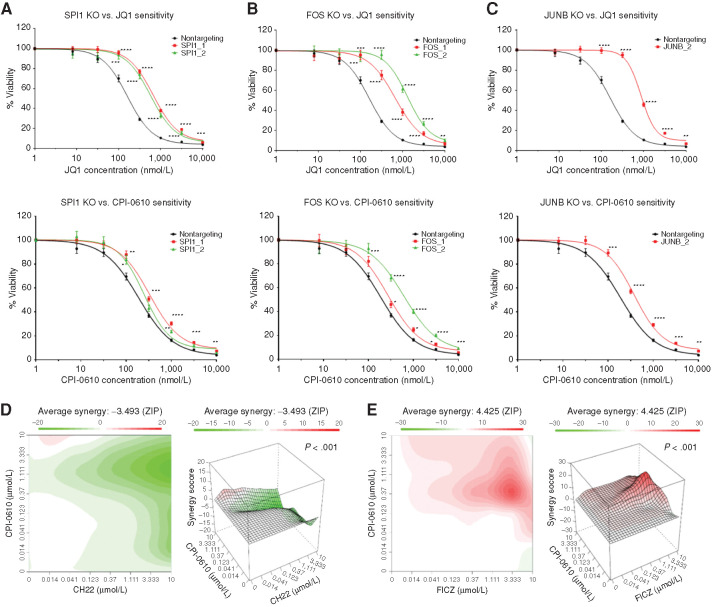
Figure 3.
Validation of whole-genome CRISPR screen hits SPI1, FOS, JUNB, and AHR signaling. A–C, OCI-AML2 cells were transduced with lentiviruses carrying custom-designed single sgRNA/Cas9 constructs (two different sgRNAs/gene) targeting SPI1, FOS, or JUNB or nontargeting. After puromycin selection and 10 days of transduction, sensitivity to JQ1 (top row), and CPI-0610 (bottom row) was measured in replicates of six via colorimetric MTS-based viability assay. Plots represent sensitivity to BETi in SPI1 KO (A; left), FOS KO (B; middle), and JUNB KO (C; right) in single sgRNA KOs (colored) versus nontargeting control (black) in OCI-AML2 cells. Error bars represent the SE margin between the six replicates. Drug curve consists of eight concentrations ranging from 0 μmol/L and 0.0137 to 10 μmol/L in log increments. P values for individual sgRNAs versus nontargeting were calculated using a two-stage linear step-up procedure of Benjamini–Krieger–Yekutieli. The x-axis represents BETi concentration; the y-axis represents OCI-AML2 viability. KO, knockout. D and E, OCI-AML2 cells were subjected to dilutions of CPI-0610 in combination with titrations of either the AHRi CH-223191 (D) or the AHR ligand FICZ (E) and evaluated for viability via colorimetric MTS-based assay. The ZIP synergy score was calculated at each drug combination dose pair as previously described (81, 82). The ZIP score average was computed across the dose matrix to provide an overall index of drug interaction. A positive average ZIP score indicates the combination was synergistic (red), whereas a negative average ZIP score indicates antagonism (green). ZIP scores were −3.493 and 4.425 for CH-223191 and FICZ, respectively. Significance of synergy determined by one-sample Wilcoxon signed rank test comparing individual dose–pair combinations across the entire 7 × 7 matrix. The x-axis represents increasing concentrations of the AHRi CH-223191 (left) or the AHR agonist FICZ (right). the y-axis represents increasing concentrations of CPI-0610.

