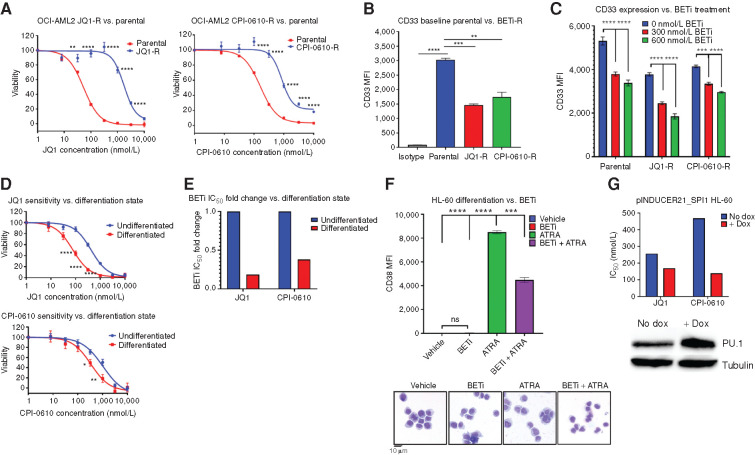
Figure 4.
BETi-R OCI-AML2 exhibit hallmarks of decreased differentiation, and forced myeloid differentiation of HL-60s increases sensitivity to BETi. A–C, BETi-R OCI-AML2 cells were generated via incubation with serially increasing concentration of JQ1 or CPI-0610 over a several month period. A, MTS viability assays were used to assess BETi dose responses in JQ1-R (left) and CPI-R (right) OCI-AML2 cells. Error bars represent the SE margin between the six replicates. P values were calculated using a two-stage linear step-up procedure of Benjamini–Krieger–Yekutieli comparing parental to BETi-R OCI-AML2 cells. The x-axis represents BETi concentration; the y-axis represents OCI-AML2 percentage viability. B, Median fluorescence intensity (MFI) of myeloid differentiation marker CD33, as determined by flow cytometry, on untreated BETi-naïve OCI-AM2 cells and BETi-R OCI-AML2 cells withdrawn from drug for 1 week. Significance determined by ordinary one-way ANOVA with multiple comparison corrections from three replicates. C, CD33 MFI, as determined by flow cytometry, of BETi-naïve or BETi-R OCI-AML2 cells treated with vehicle, 300 nmol/L JQ1, or 600 nmol/L JQ1 for 72 hours. Significance determined by two-way ANOVA with multiple comparison corrections from three replicates. D, HL-60 cells were differentiated with 1 μmol/L ATRA for 72 hours or left undifferentiated in vehicle for 72 hours. The cells were then washed in PBS, and viability was assessed (>95%) by guava easycyte. Drug dose–response curves, as determined by MTS viability assay, were then assessed for JQ1 (top) and CPI-0610 (bottom) comparing undifferentiated (vehicle) and ATRA-differentiated HL-60 cells. Error bars represent the standard error margin between the six replicates. P values were calculated using a two-stage linear step-up procedure of Benjamini–Krieger–Yekutieli comparing undifferentiated (vehicle-treated cells) to differentiated (ATRA-treated cells). The x-axis represents BETi concentration; the y-axis represents HL-60 viability. E, Fold change IC50 values for JQ1 and CPI-0610 in undifferentiated HL-60s versus ATRA-differentiated HL-60s from D. F, Top, flow cytometry measurement of CD38 MFI, which marks HL-60 differentiation state, in naïve HL-60s treated for 72 hours with vehicle (undifferentiated), BETi, ATRA (differentiated), or simultaneously added BETi and ATRA. Significance determined by one-way ANOVA from three replicates. Bottom, Giemsa stain of HL-60 cells that were previously subjected to vehicle, BETi, ATRA, or BETi + ATRA for 72 hours. G, HEK 293T cells were used to generate inducible PU.1 virus (pINDUCER21-SPI1) with packaging vectors psPAX2 and VSVG. HL-60 cells were then lentivirally infected with the inducible virus or empty vector and GFP sorted. HL-60 cells were then induced with doxycycline (dox) for 5 days, and JQ1 and CPI-0610 IC50 values were determined by the MTS assay. Corresponding Western blot validating PU.1 overexpression in HL-60 cells at day 5 (bottom). The x-axis denotes control versus pINDUCER21-SPI1 cells; the y-axis denotes IC50 for JQ1 or CPI-0610.

