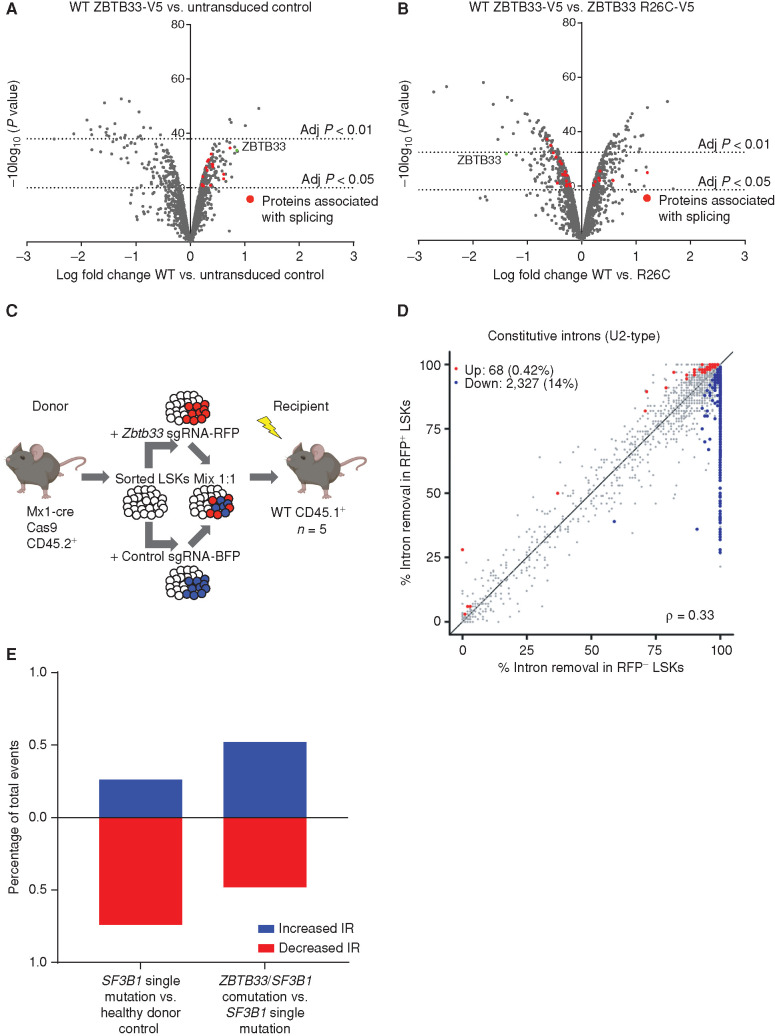
Figure 4.
Interaction of ZBTB33 with splicing-associated proteins and increased IR upon Zbtb33 loss. A and B, Volcano plots visualizing significant protein interacting partners enriched in the WT ZBTB33-V5 IP compared with control (A) and differentially enriched in the WT ZBTB33-V5 and ZBTB33 R26C-V5 IPs (B). Proteins involved in RNA splicing are colored red. C, Schematic depicting experimental setup for transplant to isolate mouse LSKs for RNA-seq experiment. Thirty-eight weeks after transplant, BM was harvested from recipient mice (n = 5). RFP+ and RFP− recipient LSKs were isolated by FACS, followed by RNA extraction and RNA-seq. D, Scatterplot comparing constitutive IR in RFP− LSKs (n = 5) versus RFP+ LSKs (n = 5). Axes measure the fraction of mRNAs with spliced introns. Red and blue dots represent introns that met the thresholds for significance (P ≤ 0.05) and effect size (absolute percentage change in isoform usage of ≥10% or log fold change ≥ 2) and were retained less or more frequently, respectively, in RFP+ compared with RFP− cells. E, Bar graphs plotting the percentage of significant IR events that were increased (blue) or decreased (red) in SF3B1 single-mutation MDS samples (n = 4) versus healthy controls (n = 3; left) and in ZBTB33/SF3B1 comutation MDS samples (n = 3) versus SF3B1 single-mutation MDS samples (n = 4; right).

