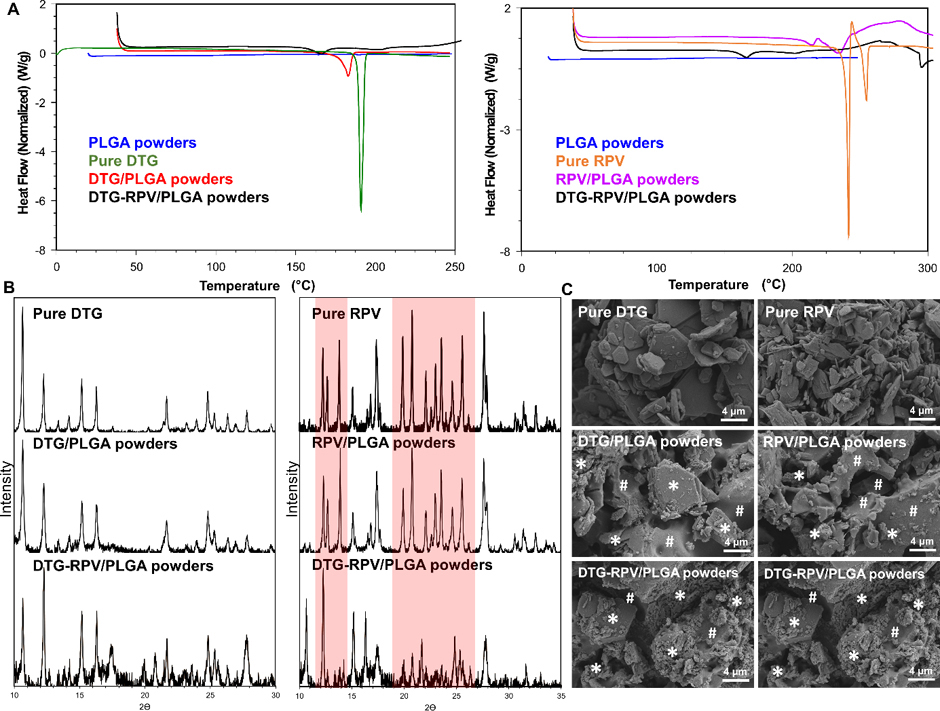
Figure 3.

Characterization of physical state of DTG and RPV when formulated individually or in combination in micronized PLGA powders. A) DSC thermograms of DTG/PLGA, RPV/PLGA, and DTG-RPV PLGA micronized powders compared to pure DTG and RPV and placebo PLGA powder. B) XRD patterns of DTG/PLGA, RPV/PLGA, and DTG-RPV PLGA micronized powders compared to pure DTG and RPV. Red highlights represent the different crystallinity patterns and relative ratios of peak intensity of RPV in DTG-RPV PLGA compared to pure RPV. C) SEM images representing microstructure of DTG/PLGA, RPV/PLGA, and DTG-RPV PLGA micronized powders compared to pure DTG and RPV. The white * symbols represent drugs (DTG or RPV) and the white # symbol represents PLGA in the DTG/PLGA, RPV/PLGA or DTG-RPV/PLGA micronized powders.
