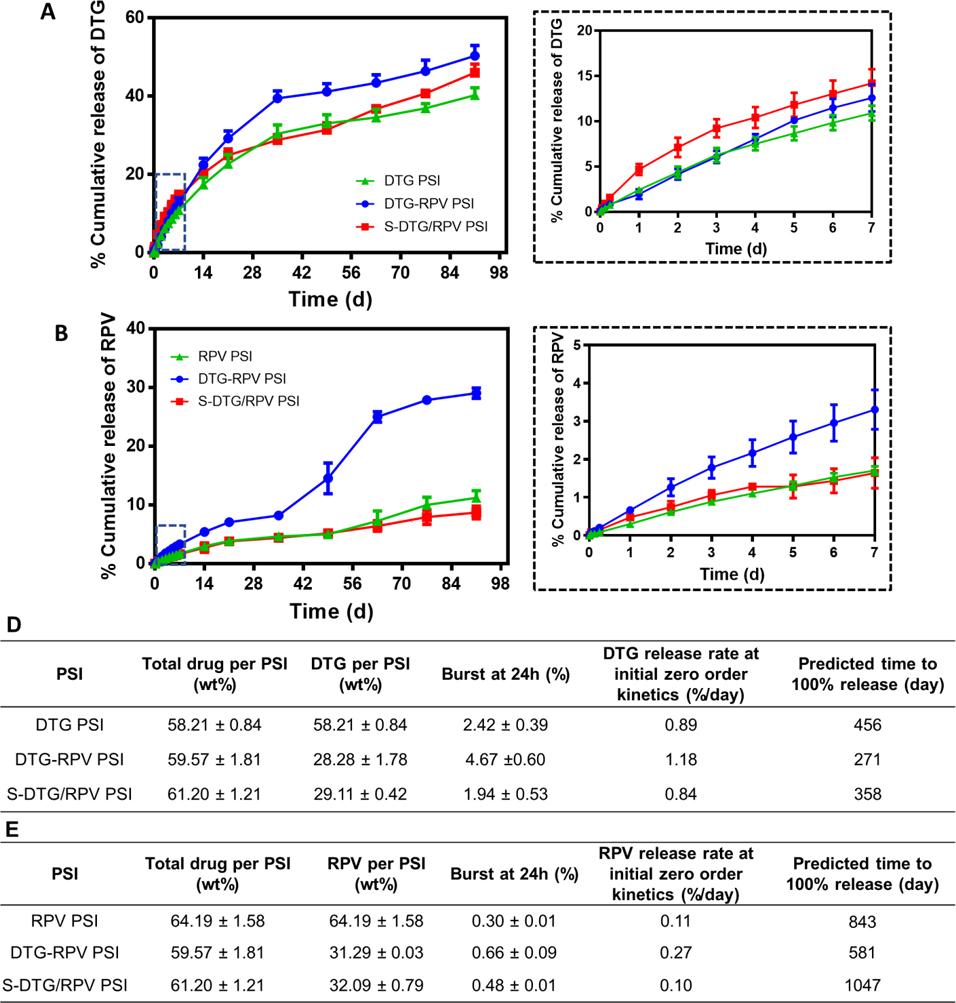
Figure 5.

In vitro release kinetics of DTG (A) and RPV (B) from single-drug DTG PSIs, RPV PSIs, and dual-drug DTG-RPV PSIs, S-DTG/RPV PSIs. Error bars represent standard deviation of n=3 samples. Insets represent the release kinetics of DTG (A) and RPV (B) during the first 7 days. C) Summary of in vitro release kinetics parameters of DTG from DTG PSIs, DTG-RPV PSIs and S-DTG/RPV PSIs (n=3). D) Summary of in vitro release kinetics parameters of RPV from RPV PSIs, DTG-RPV PSIs and S-DTG/RPV PSIs (n=3).
